
T2108 Status: 67.5%
T2107 Status: 36.0% (finally reversed all of its August angst)
VIX Status: 14.2
General (Short-term) Trading Call: neutral
Active T2108 periods: Day #22 over 20%, Day #21 over 30%, Day #21 over 40%, Day #19 over 50%, Day #4 over 60% (overperiod), Day #336 under 70% (underperiod)
Commentary
The S&P 500 (SPDR S&P 500 (N:SPY)) started November with another strong showing as the index picks up where it left off with October’s extraordinary performance. It closed with a 1.2% gain and a level last seen during the heights of August. Incredibly, the index can now see fresh all-time closing highs just over the horizon (2130.82)…

The S&P 500 (SPY) has produced a steady…and very bullish…staircase pattern onward and upward toward fresh all-time highs.
Despite this strong and bullish breakout, I cannot flip the trading bias from neutral to bullish. T2108, my favorite indicator, closed at 67.5%. So it is STILL churning below overbought territory and indicating that the on-going rally is not able to push new stocks over the hump. This churn is closing in on one month in duration. I am patiently waiting to see how the market behaves once this occurs: will the market finally lose momentum and reverse or will it get new life and launch into one of those epic oversold rallies?
T2107, the percentage of stocks trading above their respective 200DMAs, is more interesting. While T2108 has stalled, T2107 has marched along with the S&P 500. It is a slower moving index that has just now reversed all the angst from August. At 36.0%, T2107 is at a 2+ month high. Left in the rearview mirror are a W-bottom and a 50DMA breakout that defines the end of a primary downtrend.
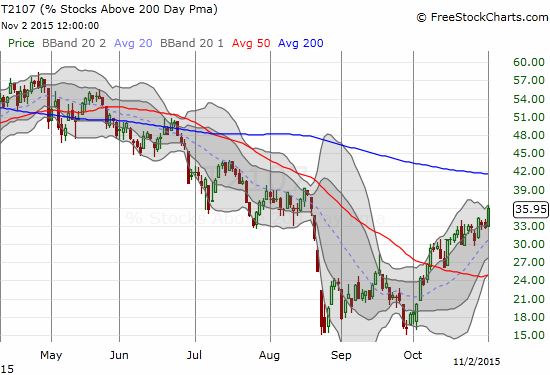
The percentage of stocks trading above their respective 200DMAs is progressing along with the S&P 500. This indicates that a lot of healing is still happening well below the surface of the market.
The volatility index, the VIX, continues along its own path of churn. It continues to trade just below the 15.35 pivot. In this position, it is not providing any clues to future direction. The VIX’s stasis mainly confirms the market’s general state of contentment. Oh how the August Angst is such a distant memory!
Caterpillar (N:CAT) is one of the most bullish developments among the stocks I follow. As readers know, I like to buy put options against CAT as a hedge on bullishness. When CAT is powering higher, I consider it a confirmation of bullishness. I blinked and suddenly realized that CAT broke out above its 50DMA and is now following through.

Caterpillar (CAT) is breaking out. It has left the disastrous post-earnings gap down far behind.
Some additional charts to consider while waiting for resolution of this tap dance with overbought status…

iShares Nasdaq Biotechnology (O:IBB) confirmed its 50DMA breakout and apparently will not provide a dip to its 20DMA as my next buying opportunity

LinkedIn (N:LNKD) clears the hurdle again. October earnings closed the gap from July earnings and formed a 200DMA breakout.

Rackspace Hosting, Inc. (N:RAX) is starting to turn the corner. Last year’s M&A talk is long forgotten: this could be the time to grab a steal under the radar.

It STILL hurts to have no Baidu (O:BIDU) in my pockets. A 200DMA breakout that closes the previous earnings gap down adds insult to injury…
My bonus chart is McDonald`s (N:MCD). A little over a year ago I suggested accumulating shares of McDonald’s to take advantage of all the negativity surrounding the venerable chain at the time. It was very fashionable to talk about how Millennials abandoned MCD. The menu was stale and unappealing for the more hip youth of today. Behind the times. Etc, etc…One new CEO later and here is MCD making a very bullish breakout to new all-time highs…
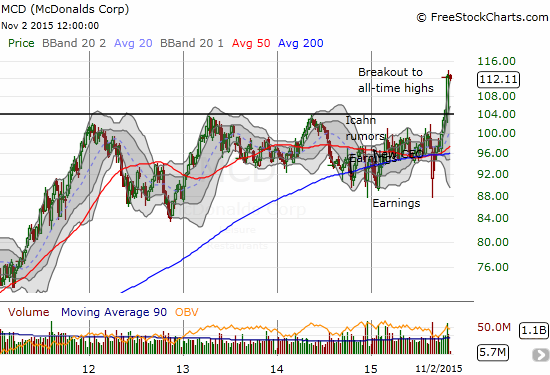
Who said McDonald’s was dead?!
Daily T2108 vs the S&P 500")
Black line: T2108 (measured on the right); Green line: S&P 500 (for comparative purposes)
Red line: T2108 Overbought (70%); Blue line: T2108 Oversold (20%)
Weekly T2108
Be careful out there!
Full disclosure: long CAT, long LNKD call spread, long MCD