Technology has come a long way. In 2000 I ordered my car with the hot new integrated StarTec flip phone. Who would even consider a flip phone now. And do you remember the robots depicted in 1970’s television? Nothing like the one above. Ever changing and at a faster and faster pace it seems.
I run a bull scan for stocks with high short interest and good technicals each day to look for short term opportunities. It gives a good place for short term traders to look for possible outperformance. But there is s side benefit of this scan as well. What I have found interesting about the results is how the sector distribution of the scan can persist over time. And the leader over the last 5 months has been the technology sector. This may not surprise many as the Nasdaq 100 has made new all-time highs.

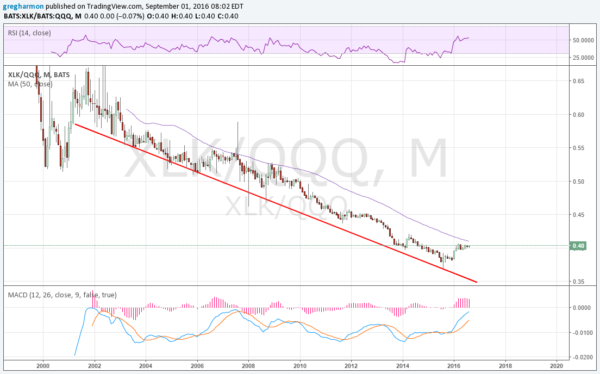
But the chart above suggests the tech rally may just be getting started. This chart shows the extreme and persistent underperformance of the Technology Select Sector SPDR (NYSE:XLK) to the broader PowerShares QQQ Trust Series 1 (NASDAQ:QQQ) on a monthly basis since 2000. The QQQ outperformed the XLK by nearly 2 to 1 over the past 16 years. That technology rally is but a blip higher in December and then a consolidation.
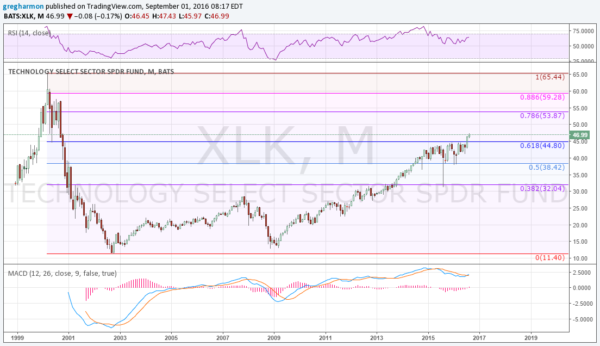
So with the Nasdaq making all-time highs how can the Technology ETF be so far behind? More importantly for investors, does it have more room to improve? The chart above says that it does. But the chart below may tell how much room it has. It shows just the Technology ETF over this timeframe.

A pretty good trend has been in place since the 2009 low. You can also see the consolidation that took place for most of 2015 between the 50% and 61.8% retracement of the drop during the tech crisis in 2000. It is the last two months that sees first a break over that 61.8% retracement, and then continuation in August. Continuation would look for a move to the 78.6% or 88.6% retracements as a next target.
The momentum indicators on the chart support more movement higher. The RSI has been bullish since early 2009. During the 2015 consolidation it pulled back but remained bullish and may be rising again. And the MACD pulled back in 2015 too, holding positive, but is now about to cross up. That is a buy signal. Technology, despite being a leader the last 5 months, may still have a lot of upside left to it.
The information in this blog post represents my own opinions and does not contain a recommendation for any particular security or investment. I or my affiliates may hold positions or other interests in securities mentioned in the Blog, please see my Disclaimer page for my full disclaimer.
