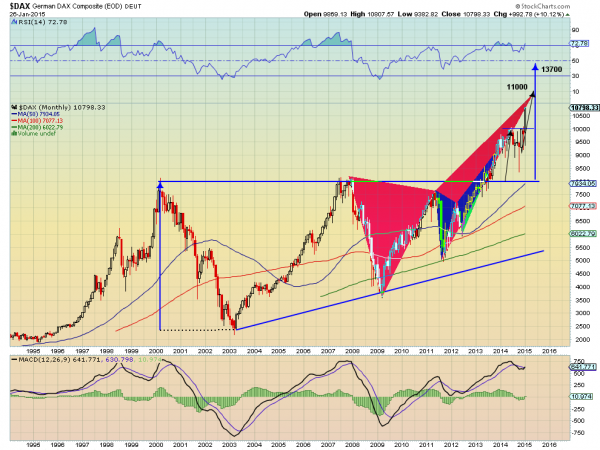
The German DAX spent most of 2014 in a tight range between 9000 and 10000. This led many to talk about the top of the market being in. But with a new round of Quantitative Easing, from the ECB this time, and Greece electing a crazy government, the eurozone is not running like a finely tuned Mercedes. Yet Angela Merkel is smiling despite these eurozone problems. What does she know that the general public doesn’t? Maybe she is a closet Technical Analyst and can see the long term potential in the monthly chart of the German DAX.

The chart above is a bit crowded so lets walk through it piece by piece. First, there is the long ascending triangle that began with the drop from resistance in 2000 and was finally broken to the upside in 2013. The Measured Move from this break out higher is to 13700 as noted by the blue arrows.
The second pattern in the chart is a bearish Deep Crab harmonic. This is the 2 red triangles. It carries a Potential Reversal Zone (PRZ) at 11000. It is a bearish pattern because if it does reverse after hitting that level it can be expected to pullback at 38.2% of the full pattern, or to about 8100. That would be a retest of the Ascending triangle break out level. Eerie?
But it is called a Potential Reversal Zone for a reason. It is not guaranteed. In fact a look at the shorter set of 2 blue triangles shows another Deep Crab that reached its PRZ at 9360 in late 2013. It did not pull back. Even if you stretched it to count the October 2014 move lower, it still came no where near the 7700 target a 38.2% retracement would look for. That is a sign of strength.
So now after consolidating in the 1000 point range for a year it is moving higher. This brings the third technical view into play. The Measured Move from the consolidation just after the Ascending Triangle break to the top of the consolidation range at 10000 looks for an advance to 11000 as well.
The momentum indicators give upside support as well. The RSI has worked off a overbought condition and is ring again, back into overbought territory. But the reading is not near the peak levels in 1997, 1998 and 2007. There is plenty of room to run hotter. The MACD has pulled back from a peak that has led to a price correction in previous touches. But as January comes to a close the MACD is about to cross back up, a buy signal.
All signs point higher. Perhaps that is why Angela is smiling.
Disclaimer: The information in this blog post represents my own opinions and does not contain a recommendation for any particular security or investment. I or my affiliates may hold positions or other interests in securities mentioned in the Blog, please see my Disclaimer page for my full disclaimer.
