As long time readers know, I usually focus on intermediate-term indicators because our core portfolios attempt to catch intermediate term up trends (and avoid large draw downs). I don’t often focus on long-term indicators so I thought it would be good to step back a bit and see what the very long-term indicators are telling us. For the most part they are still showing healthy readings that indicate a long-term bull market, but they’re starting to stall.
SPX: Bullish AND Bearish
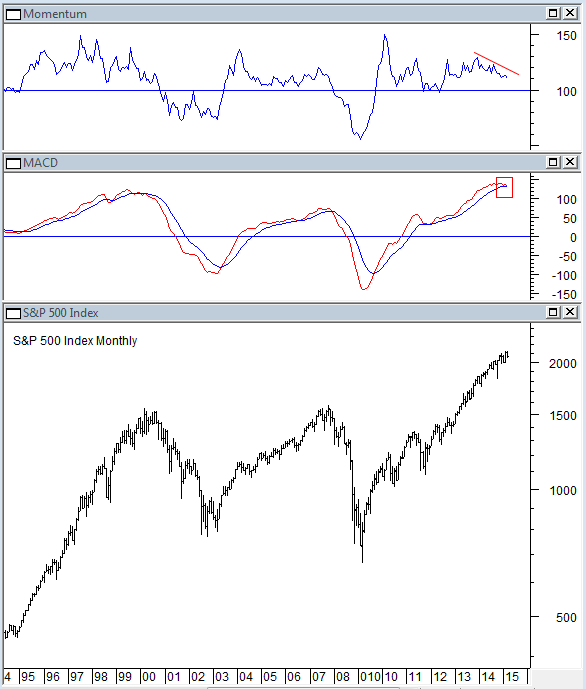
Over the past month the monthly MACD for the S&P 500 Index has been crossing back and forth between a bullish and bearish cross. Momentum for S&P 500 is diverging from price as well. As you can see from the chart below, these two indicators have been losing strength for well over a year. For that reason, they aren’t very timely so instead of using them to indicate portfolio allocation changes I use them as warning to watch intermediate-term indicators more closely.
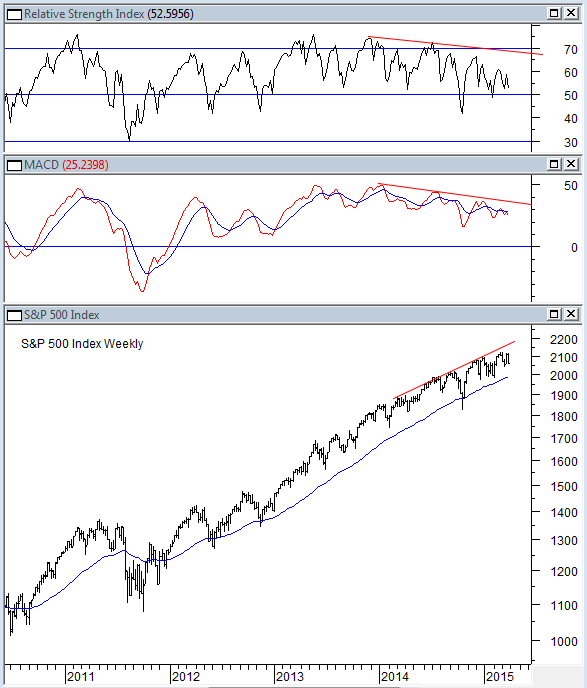
Looking at S&P 500 on a weekly chart you can see both RSI and MACD have been diverging from price over the same time frame that the monthly indicators have been weakening. The message is that the trend is stalling and for most of 2014 and 2015 the market has been working off the over-bought reading from the huge run higher in 2013. They are now at levels that a healthy correction will bring their readings back to levels that would help the market sustain the next uptrend.
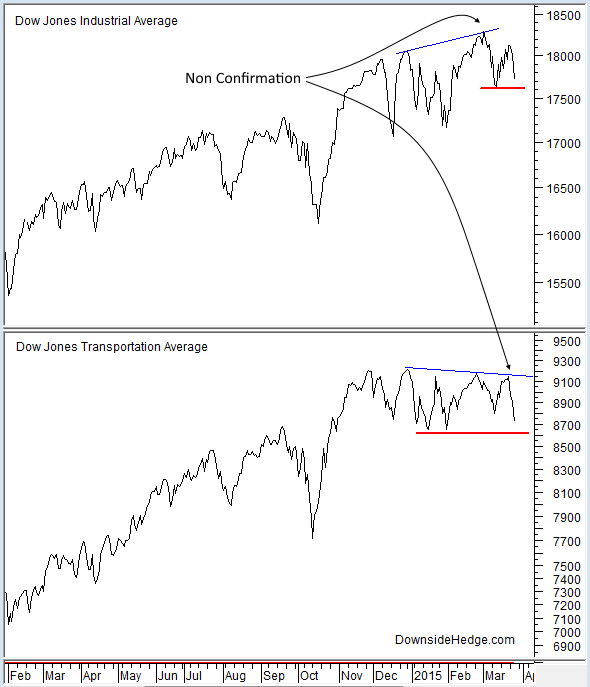
Dow Theory is another tool we can use for the long-term trend. Currently it has a non confirmation in place. The industrials made a new high at the first of March, but the transports continued to decline. This is a minor caution sign, but won’t hold much weight for me unless recent lows are broken. That would put both indexes in a down trend that has lasted more than three weeks. If that happens, I’ll be watching for a new secondary low to be put in place. That secondary low will be the trigger point that turns Dow Theory from bullish to bearish. But for now, Dow Theory is still indicating a long-term bull market is in place.
The Twitter Stream: Bullish Vs. Bearish
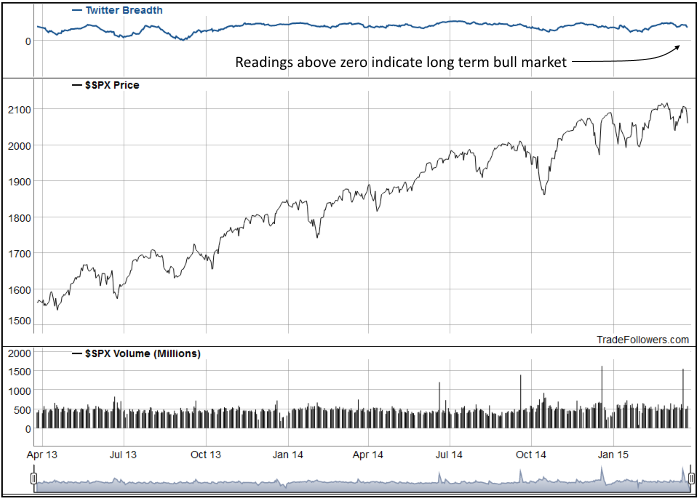
I use the Trade Followers breadth indicator as a long-term indicator as well. It calculates breadth between the most bullish stocks and bearish stocks on the Twitter (NYSE:TWTR) stream. It is a good indicator to watch for turns in sentiment by active market participants. Currently, it is showing a large decrease in the number of bullish stocks. The current count of bullish stocks is only slightly above levels seen near the lows last October and January of this year. The indicator is holding up because the number of bearish stocks isn’t growing rapidly. The number of bearish stocks is well below both October and January. This tells us that the general market is being held up by bottom fishing. Money managers are selling high fliers and buying beaten up stocks. You can see current readings for Twitter breadth here.
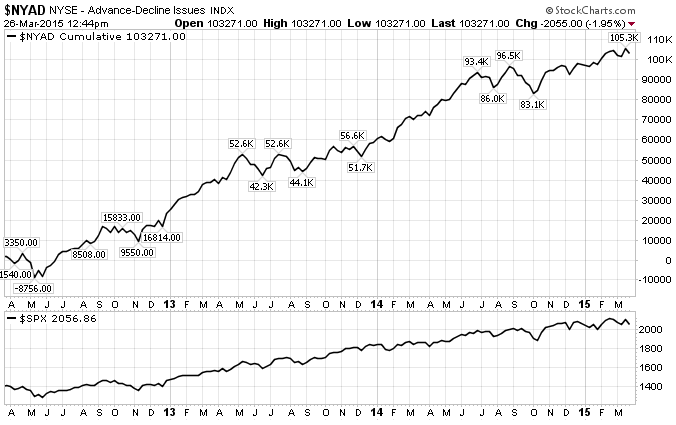
Now back to the intermediated term. I’m continuing to watch the NYSE Advance/Decline line (NYAD). Until it breaks down, I don’t think we will suffer a serious correction. It is another sign that bottom fishing is occurring.
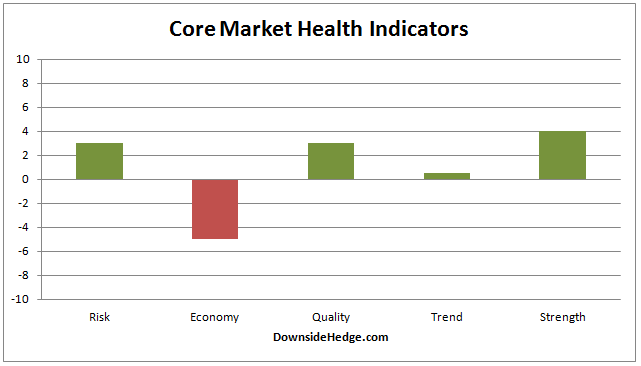
Our core health indicators bounced around this week, but not enough to change any of our core portfolio allocations.
