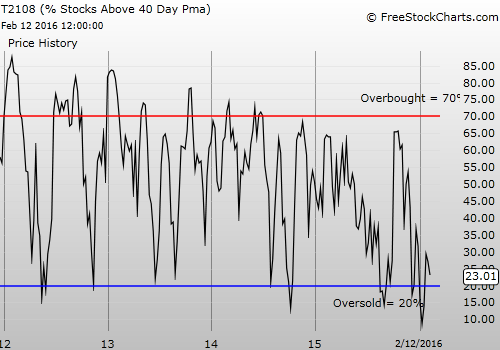
T2108 Status: 23.0% (ends a 1-day oversold period)
T2107 Status: 15.2%
VIX Status: 25.4
General (Short-term) Trading Call: bullish
Active T2108 periods: Day #1 over 20% (ends 1 day oversold and under 20%) (overpriod), Day #29 under 30%, Day #45 under 40%, Day #49 below 50%, Day #64 under 60%, Day #405 under 70%
Commentary
FINALLY. The market delivers a more typical oversold period. Perhaps, just maybe, market sentiment is starting to turn. In deference to market hope, I focus more on the positives in this post.
“Oversold” trading conditions occur when T2108 drops below 20%. T2108 quantifies the percentage of stocks trading below their respective 40-day moving averages (DMAs). The typical oversold period lasts just one or two days. T2108 closed on Friday at 23.0% and left behind a 1-day oversold period.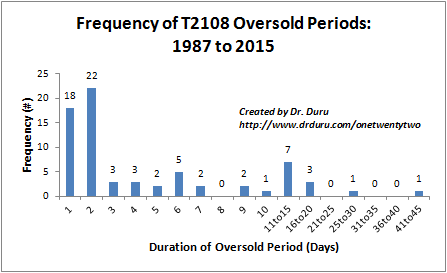
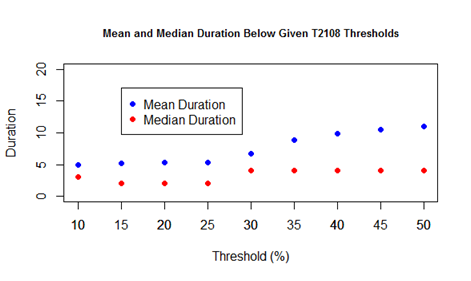
This frequency (distribution) chart for oversold duration shows that over half of oversold periods last just one or two days.
Mean and Median Duration Below Given T2108 Threshold
The T2108 Trading Model relies on the short-lived nature of oversold periods for its biggest successes. This behavior explains why I prefer the aggressive strategy to jump right into the pool as soon as T2108 dives into oversold territory. Since August, the market (via the S&P 500) has twisted and churned through some intense oversold periods with sellers maintaining a lot of influence and control. The more intense oversold periods require a secondary strategy that includes triggering subsequent trades off the volatility index, the VIX. When the VIX surges during an oversold period, invariably, a bottom is at hand. This year’s oversold periods have not experienced true surges. Instead, bottoms have occurred at or near resistance for the VIX. This resistance sits (coincidentally?) at the intraday high from 2012.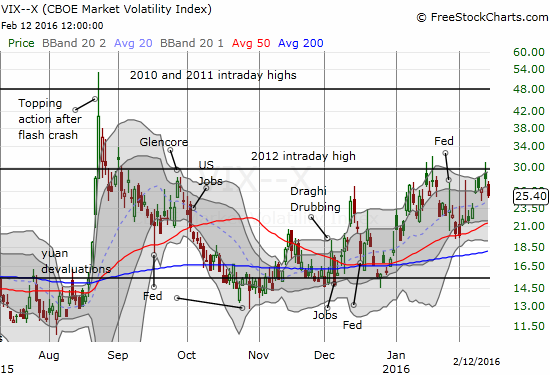
The VIX has consistently failed to push through resistance this year.
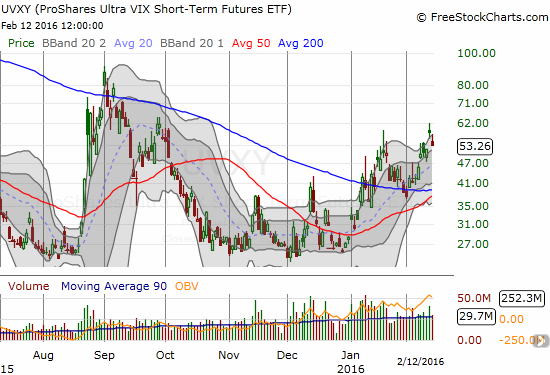
ProShares Ultra VIX Short-Term Futures (N:UVXY) gaps down along with the drop in volatility.
The chart of the VIX shows that the August Angst delivered a true volatility surge. It also sets the bar for the next true surge in volatility. Note that pushes well above the upper-Bollinger® Band (BB) are sufficient to define a true surge.
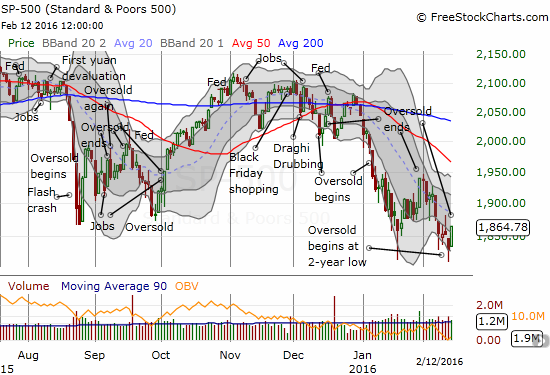
The frequency of the oversold periods since August has presented another challenge. Trades coming out of the oversold periods have generally become unsustainable. Traders have had to apply quick triggers to lock in profits. I have increasingly considered more bearish positions outside of oversold periods. Coming out of this latest oversold period, the S&P 500 (SPDR S&P 500 (N:SPY)) is barely trading off 2-year lows. In other words, these oversold periods are inflicting steady damage on the index. The failure of buyers to sustain momentum has provided sellers the opportunity to sink the index ever lower. Since December, each oversold period has started with the S&P 500 trading at a lower level.
The S&P 500 is still breaking down.
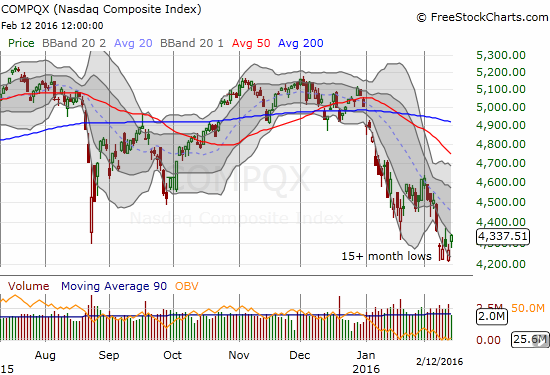
The NASDAQ is still trapped in a downward-trending channel as it struggles to print a bottom.
This year started with a vicious downtrend channel for the S&P 500 and the NASDAQ. A declining 20DMA quickly capped the subsequent rally out of oversold conditions for both major indices. Coming out of the last oversold period, I had targeted the 50DMA as resistance before the next oversold period. Now, I can only look to the 20DMA as a first upside target or around 1900 on the S&P 500.
The currency pair AUD/JPY – the Australian dollar (Guggenheim CurrencyShares Australian Dollar (N:FXA)) versus the Japanese yen (Guggenheim CurrencyShares Japanese Yen (N:FXY)) – has well-mapped the on-going deterioration in market technicals. AUD/JPY last peaked in May right along with the S&P 500. The 50DMA and 200DMA have alternated as stiff resistance for the currency pair. AUD/JPY printed an impressive recovery from the latest lows, but buyers have a long way to go to prove that move did not completely exhaust them.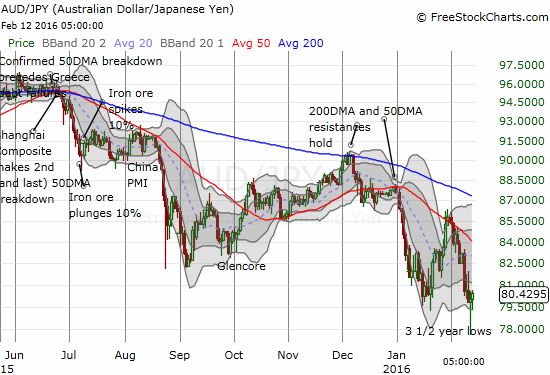
AUD/JPY is attempting to print a steep bottom at 3 1/2 year lows.
The most intriguing evidence of a bottoming underway comes from the financial sector. Of course, this past week, I finally turned my attention to using the bearishness in this sector as a complement to my set of hedges against bullishness. Jamie Dimon, CEO of JP Morgan Chase (N:JPM), must have heard me. My posting was clearly his signal to step up and load up on shares. Dimon purchased a cool $26.7M worth of shares on February 11, 2016. The news sent JPM gapping up to a whopping 8.3% gain that neatly placed the stock right back in the middle of the churn that has defined trading since mid-January.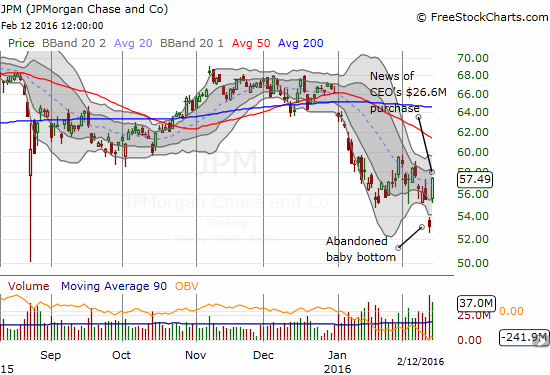
Did CEO Jamie Dimon ignite a major bottom in JP Morgan Chase (JPM)?
More importantly, the move left behind what technicians call an abandoned baby bottom. This pattern sets up a major bear trap and the potential for a major bottom. The first move is a gap down that ignites fear and panic: weak hands dump stock and shorts chase. JPM gapped down on February 11th to a 4.5% loss. The subsequent gap up delivered an instant loss to bears and started the pressure to cover. Holders who sold in a panic the previous day feel the pressure to buy back out of fear of getting left behind. This abandoned baby bottom is particularly severe; the 8.3% gain may have already absorbed the majority of the buying panic. This bottom now serves as a VERY important line in the sand for bears and bulls. I have to assume the bulls have won until sellers at least manage to close the gap up.
I will never forget how Dimon’s $17M purchases of JPM shares in late July, 2012 marked a major bottom. At that time, Dimon boosted his ownership in the bank to 18%. I jumped into the stock quickly but also took profits too quickly several weeks later. In three years, JPM doubled in value. I am NOT saying the same outcome lies ahead, but I definitely put the bearish corners of my brain on notice.
In the last T2108 Update, I noted that I held onto my Financial Select Sector SPDR ETF (N:XLF) puts despite the big gap down and downdraft. I am continuing to hold the puts as an important hedge with an expiration in March.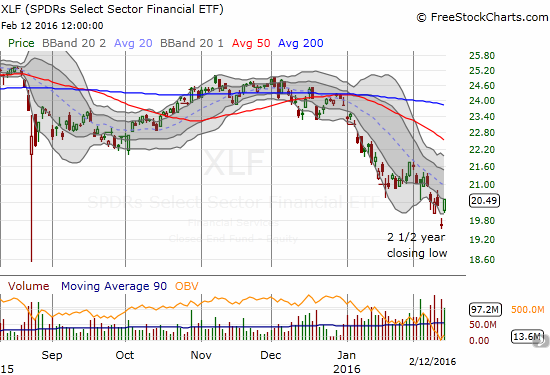
Dimon’s major insider buying reverberates throughout the financial sector. Financial Select Sector SPDR ETF (XLF) prints its own abandoned baby bottom.
An abandoned baby bottom in the financial sector coming out of an oversold period presents a very powerful signal. Despite my growing wariness, I have to stick to the rules and assume this is a major bullish sign until sellers prove otherwise. I am putting a complete freeze on further bearish positions and sticking to the bullish side for future trades. This includes any subsequent dips into oversold territory.
One major insider purchase that has not received vindication is in Wynn Resorts Ltd. (O:WYNN). The stock soared on Friday by 15.8% in post-earnings trading, but the stock is still below the close on the day news went out that CEO Steve Wynn had loaded up on 1M shares. Additional buying interest from here would finally mark a potential turn in sentiment with a first upside target at declining 200DMA resistance around $79. Otherwise, WYNN offers a cautionary tale for automatically chasing insiders who use their riches to buy more of their company’s stock.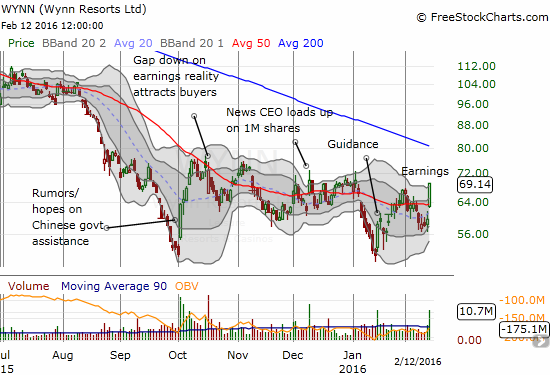
Wynn Resorts Ltd. (WYNN) returns to flat for 2016 but has yet to add momentum to Wynn’s insider purchase in December.
With oil surging 12% on Friday for its biggest one-day (intraday) percentage gain since 2009, commodities are also in major focus. Rumored production cuts presumably drove this latest buyer’s panic. However, this is yet one more classic example of bear market trading action where traders over-react to every little tidbit of rumor. Let’s get those production cuts before we get too excited. United States Oil (United States Oil (N:USO)) barely benefited from the surge, managing only to print a 4.2% gain. A bigger move would have given me confidence that USO approximately confirmed the bottom from January. So far, this latest bottom in USO looks set to end a LOT sooner than I expected.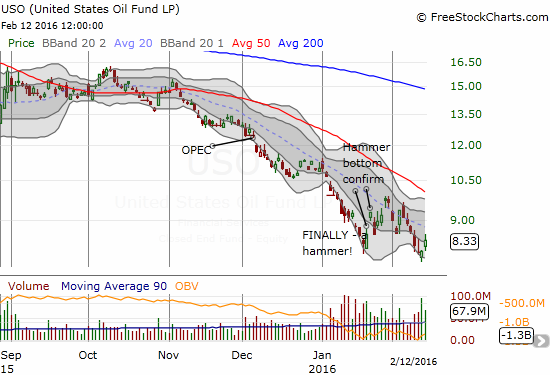
USO barely benefits from the big one-day run-up in oil and leaves a confirmation of a bottom in doubt.
Until some real evidence shows up of a turn in commodities, I am staying in fade the rally mode outside of oil. Accordingly, I used the big 7.2% move in BHP Billiton (N:BHP) to triple down on my put options on the stock. I hit March expiration to increase my hedge duration and give enough runway for over-reactions to fizzle out.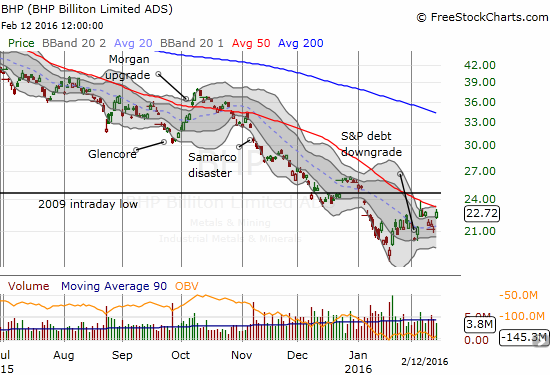
BHP Billiton Limited (BHP) jumps toward declining 50DMA resistance again.
The commodities I REALLY like here are gold and silver. SPDR Gold Shares (N:GLD) looks better than iShares Silver Trust (N:SLV). More on these another time.
Daily T2108 vs the S&P 500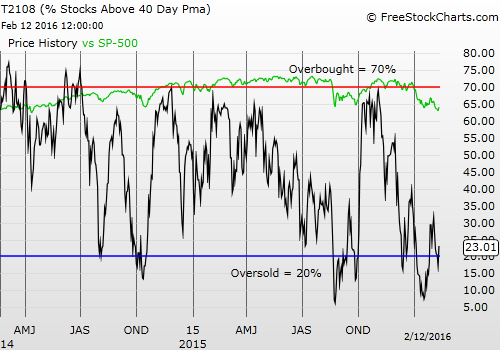
Black line: T2108 (measured on the right); Green line: S&P 500 (for comparative purposes)
Red line: T2108 Overbought (70%); Blue line: T2108 Oversold (20%)
Be careful out there!
Full disclosure: long SSO call options, long SSO shares, long SVXY shares, long UVXY puts, long TLT, long BHP put options, long XLF put options, short AUD/JPY, long GLD

