Get 40% Off
⚠ Earnings Alert! Which stocks are poised to surge?
See the stocks on our ProPicks radar. These strategies gained 19.7% year-to-date.
Unlock full list

The Indian Rupee: A Textbook Case In Classical Charting Principles

Published 06/10/2015, 12:35 AM
Updated 07/09/2023, 06:31 AM

The U.S. dollar / Indian rupee is at a critical juncture on the price charts

Some stocks, foreign exchange crosses and futures markets chart better than others. The USD/INR currency crossrate has been a textbook example of classical charting principles since 2008. A number of remarkably well-defined chart configurations have occurred during this period.

The bull trend in the cross began in 2008 by completing a near perfect rectangle bottom, as shown on the closing price chart below. Using a closing-price chart eliminates intra-day volatility and displays the true price of a currency cross. Note the retest in Apr 2008.
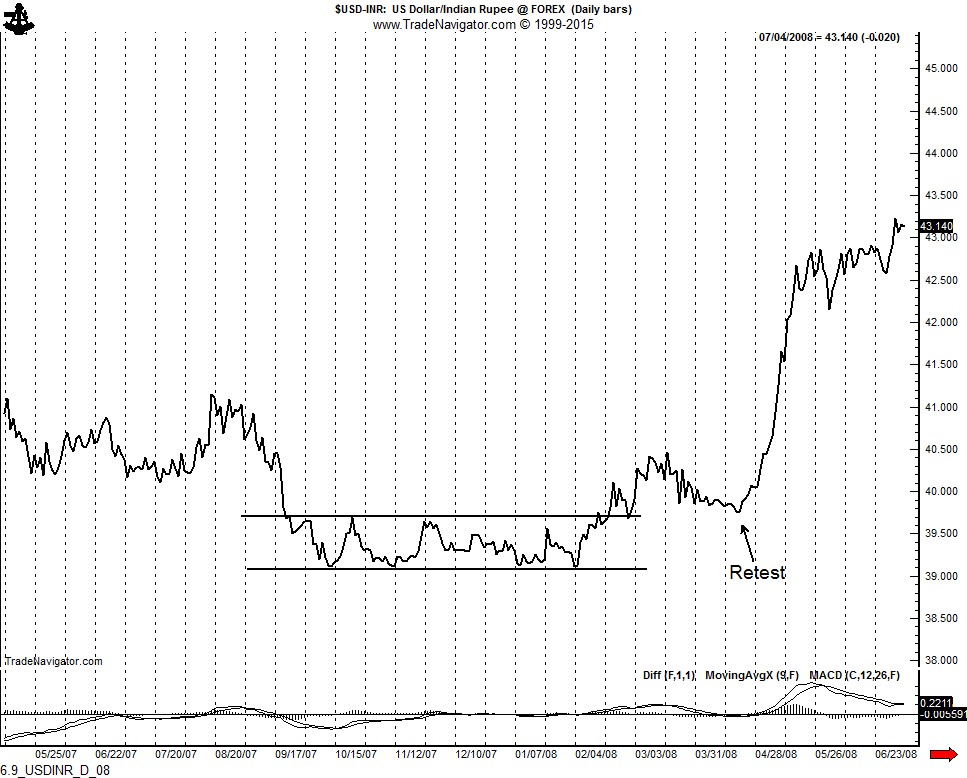
USD/INR: Closing Price Chart

After topping in Mar 2009 (resulting in a H&S top that did not fulfill its implications), the subsequent decline terminated with a 17-month rounding pattern on the weekly graph. This pattern was completed in Sep 2011.
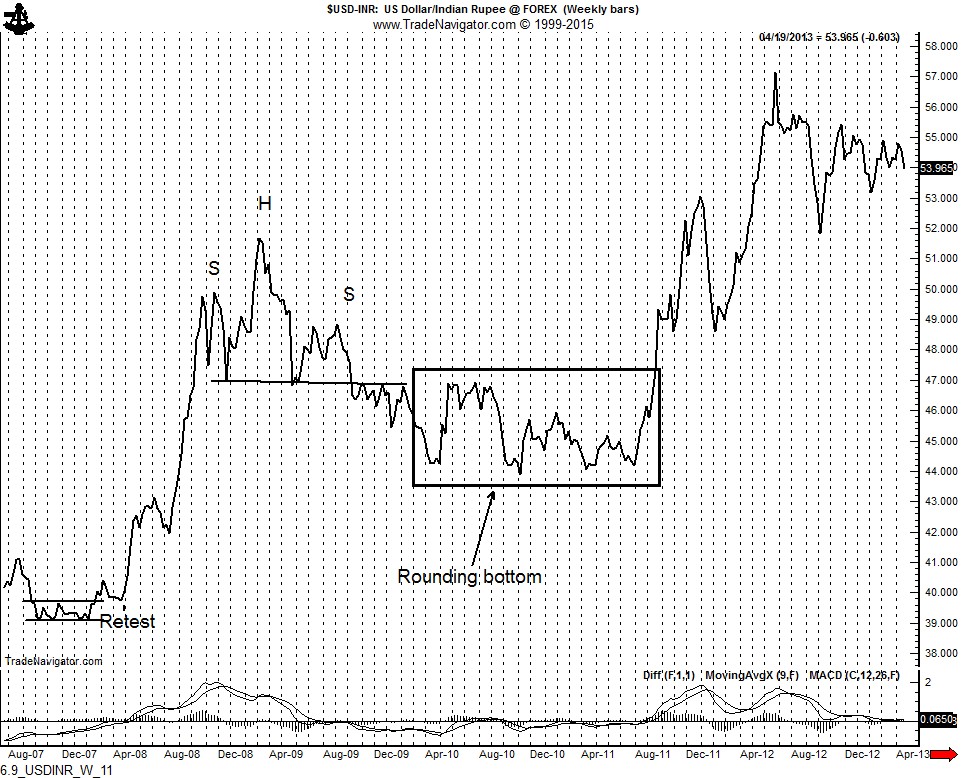
USD/INR Weekly Chart

A 10-month symmetrical triangle was completed on the weekly graph in May 2013 and led to the final blow-off top in Sep 2013.
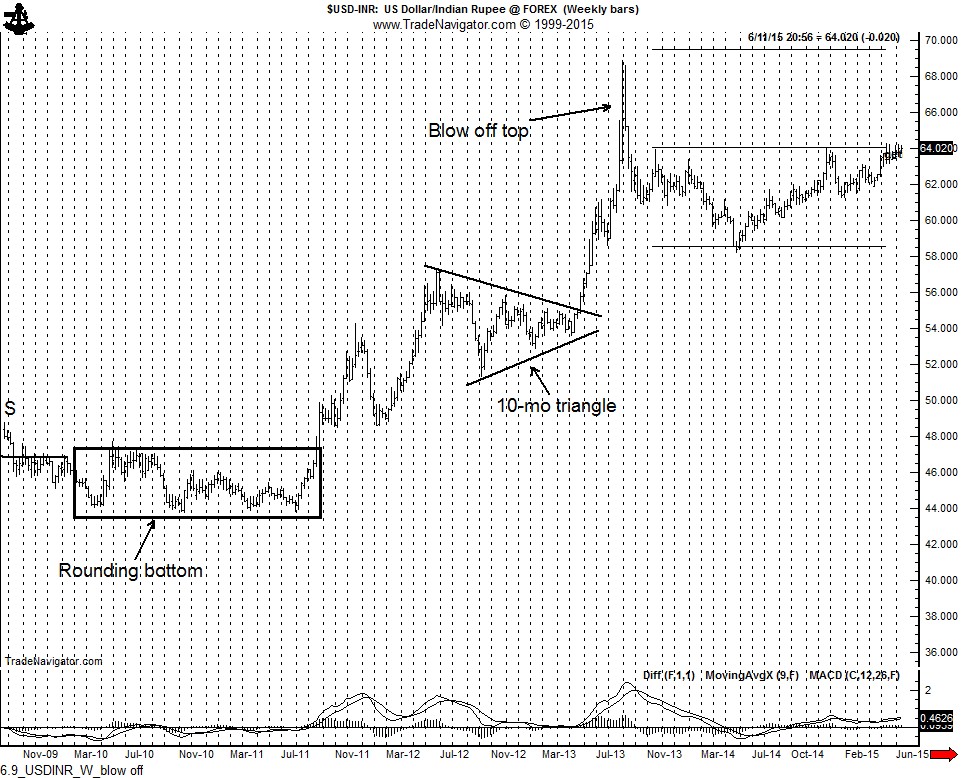
USD/INR Weekly Graph: Blow-Off

The crossrate has been forming a continuation inverted H&S pattern since Sep 2013, as shown below on the weekly OHLC graph.
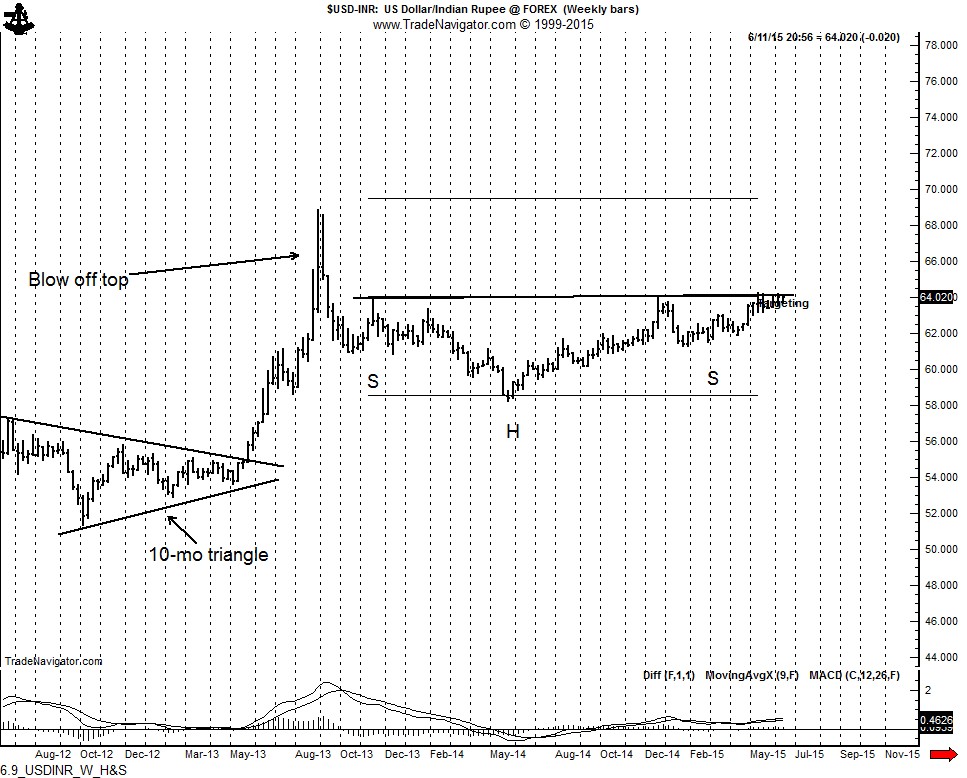
USD/INR: Weekly Head And Shoulders Chart

The market has been creeping just under the neckline for the past seven weeks, making some intraday jabs through this important resistance line. However, the cross has not been successful in completing this pattern. This hesitation cannot last forever. The chart is reaching a critical juncture. Either a decisive close above 64.50 will complete the H&S and establish a target of 69.50, or the upside momentum will fail. In this case, the daily chart would likely morph in an unpredictable manner.
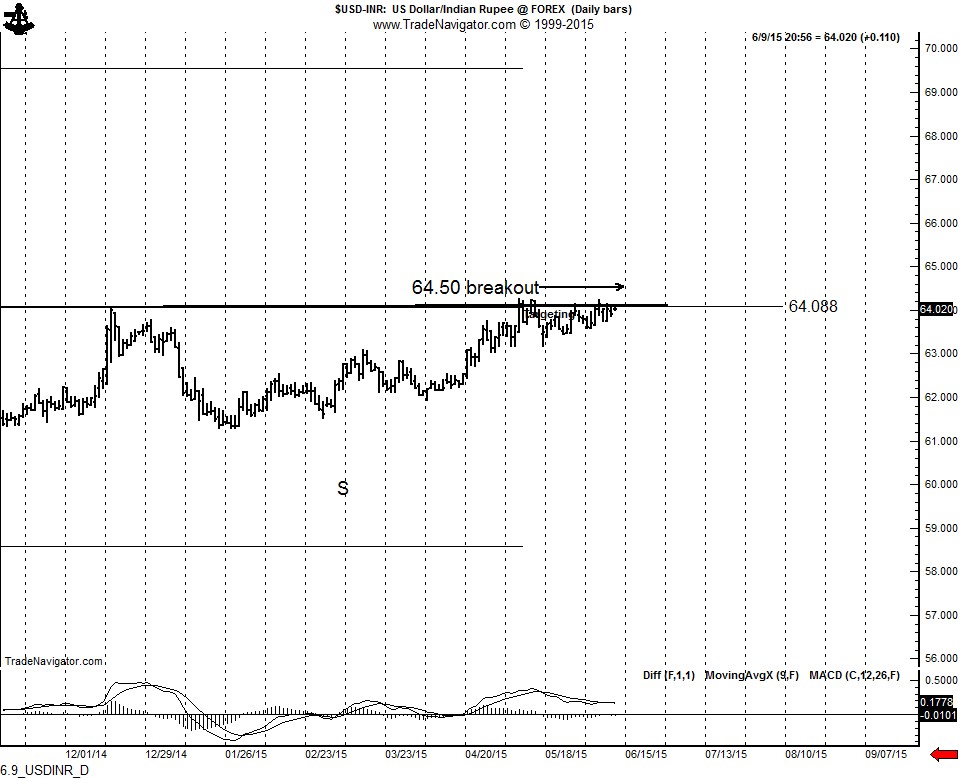
USD/INR Daily Chart

I am a buyer of the USD/INR if a decisive upside breakout occurs. If I become a buyer, my protective stop would likely be to under 63.40. My sizing would be such that my risk would be about 60 basis points.

This post represents the type of analysis provided on a regular basis to members of the Factor Service. I am happy to report that India is represented in the Factor community, as shown on the map of Factor members below.
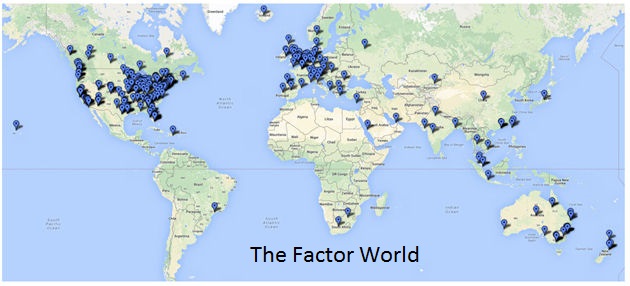
The Factor World

DISCLAIMER: The information in this blog post represents my own opinions and does not contain a recommendation for any particular security or investment. I or my affiliates may hold positions or other interests in securities mentioned in the Blog, please see my Disclaimer page for my full disclaimer.

Latest comments

But if INR breaks 64.5 level then it can either show a double top or break through life time high !! And for this to happen FED needs to hike rates in June itself !! Otherwise its difficult to see this happen !!
Risk Disclosure: Trading in financial instruments and/or cryptocurrencies involves high risks including the risk of losing some, or all, of your investment amount, and may not be suitable for all investors. Prices of cryptocurrencies are extremely volatile and may be affected by external factors such as financial, regulatory or political events. Trading on margin increases the financial risks.
Before deciding to trade in financial instrument or cryptocurrencies you should be fully informed of the risks and costs associated with trading the financial markets, carefully consider your investment objectives, level of experience, and risk appetite, and seek professional advice where needed.
Fusion Media would like to remind you that the data contained in this website is not necessarily real-time nor accurate. The data and prices on the website are not necessarily provided by any market or exchange, but may be provided by market makers, and so prices may not be accurate and may differ from the actual price at any given market, meaning prices are indicative and not appropriate for trading purposes. Fusion Media and any provider of the data contained in this website will not accept liability for any loss or damage as a result of your trading, or your reliance on the information contained within this website.
It is prohibited to use, store, reproduce, display, modify, transmit or distribute the data contained in this website without the explicit prior written permission of Fusion Media and/or the data provider. All intellectual property rights are reserved by the providers and/or the exchange providing the data contained in this website.
Fusion Media may be compensated by the advertisers that appear on the website, based on your interaction with the advertisements or advertisers.
© 2007-2024 - Fusion Media Limited. All Rights Reserved.