When we approach the stock market, it can be daunting for even the most experienced of traders. Although fundamentals play a large role in the determination of stock prices over the long term, sentiment is often the catalyst at work in short to intermediate term fluctuations.
“When torrential water tosses boulders, it is because of its momentum; when the strike of a hawk breaks the body of its prey, it is because of timing. Thus, the momentum of one skilled in war is overwhelming, and his attack precisely timed. ”— Sun Tzu, "The Art of War"
Our emotions are often experienced in waves of varying momentum: when we're excited, we may lavish in our successes, whereas when we're demoralized, we may feel like throwing in the towel and calling it quits altogether.
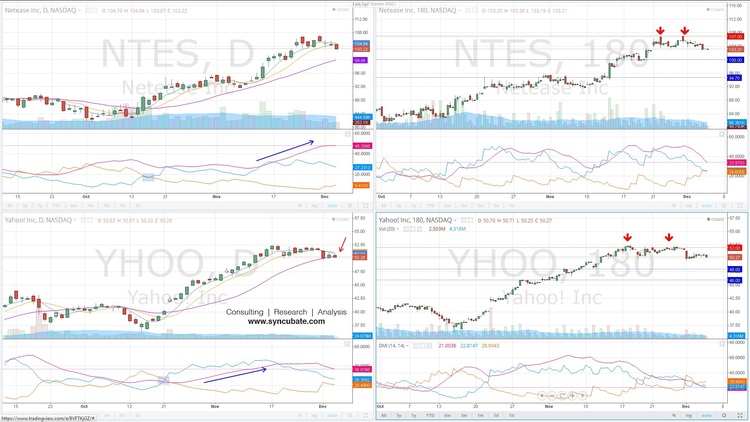
These waves of momentum are evident in stock prices over various time frames. In this case study, we'll take a look at NetEase Inc. (NASDAQ:NTES) and Yahoo! Inc. (NASDAQ:YHOO) and compare the recent run up in both stocks on the daily versus three hour charts, paying particular attention to the shifts in underlying bullish versus bearish sentiment by assessing price action.
Daily Chart Comparison:
Both NTES and YHOO have seen a significant rise in their stock prices since the middle of October. The bulls remain in control of both markets on the daily time unit, as +DMI remains above -DMI.What distinguishes both stocks is the ADX line is beginning to trend lower for YHOO, which may be indicative of a pause in the rising trend. This is further validated by the fact that YHOO closed below its 21 day moving average today for the first time since 10/21, finishing at $50.28.
NTES is still holding above its 21 DMA, though it has now closed below both its 5 DMA and 9 DMA for the first time since its trending move higher picked up the pace in mid-November, as noted by the rising ADX line starting from that point.
Three Hour Chart Comparison:
YHOO has evidently stalled out at the $52 level, having been unable to overcome this price point despite the last two weeks of flirting with it.
On Monday, the bears dragged YHOO down to the $50 level and the bulls have not reclaimed the previous highs. -DMI is beginning to rise and has held above +DMI for several days now; this is the first such occurrence since mid-October, so bearish conviction is mounting.
NTES bulls were humbled by the $107 level twice last week and have yet to reclaim it this week. The ADX line is declining, so a range trade may be in order for now, with the $100 level being critical for sustaining bullish momentum.

