
Long time readers of The Gold Update know that our microphones are just about everywhere, the latest instance being at Mission Control in Houston this past Thursday in concert with the Federal Open Market Committee's policy decision as regards the Federal Reserve Bank's Funds Rate:
"Uh, hullo Cape Canaveral, this is Cap Com Houston. Congrats on 'Lift-Off'. We've got your vehicle tracking nicely."
"Cap Com, this is Cape Canaveral. Must be some mistake: we've got the rocket still attached to gantry here on launch pad Fed..."
"Uh, Canaveral, this is Houston, no mistake: see to launch pad Gold. Flawless 'Lift-Off' recorded Thursday at 14:00 Eastern Daylight Time...
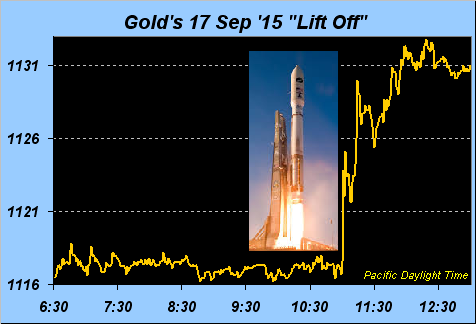
...you're at the wrong pad."
"Cap Com, this is Canaveral, we heard nothing..."
"Uh, Canaveral, Houston again. Booster rockets powered by Tesla, flash effects by Hollywood."
"Cap Com, this is Canaveral ... awkward..."
"Uh, Canaveral, Houston, no worries: media outlets missed it as well. Your vehicle now tracking toward turning weekly parabolic Gold trend to Long. Standing by for red dot separation."
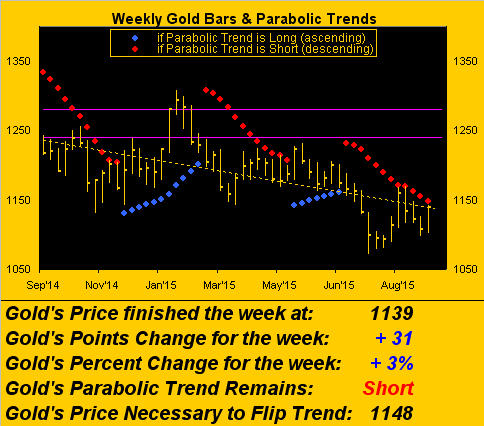
Whether 'tis truly a blast-off for Gold or just another fake-out break-out, price settling Friday at 1139, as we above see in the weekly bars, is just nine li'l ole points away from piercing the rightmost red dot at 1148, which in turn ought send us higher still. With Gold having been sold time and time again for the same reason ("The Fed's gonna raise rates"), at the very least, turnabout is fair play that going forward it be bought time and time again in reversing the rationale.
Indeed in a week's time we've gone from "Gold Dead Ahead of the Fed" to, as an alternate title, "Gold Sizzles as the Fed Fizzles". In hindsight, most Fed observers had rightly opined that the FOMC would stand pat, as did nine of its ten voting members. Notwithstanding Richmond's Jeff Lacker having formally dissented in finally breaking policy unanimity, the scrutineered assessments specified by the group for not raising the Fed Funds rate -- weakening global growth and increasing volatility in the markets -- are hardly subsiding.
Thus, toward those elements staying true to their present form, the Fed ought not raise rates anytime soon, barring a substantive lift in the Economic Barometer, (and/or, by the way, corporate earnings doubling to catch up to the price level of the S&P 500, our "live" P/E at present being 34.0x). We therefore see no rate rise in the cards being dealt by the Fed for the foreseeable future, as we turn to the Econ Baro, superimposed as usual on the S&P:
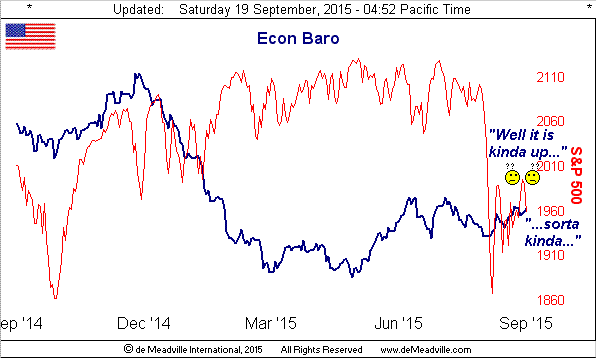
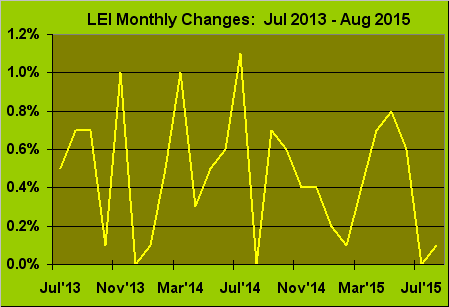
In fact, let's go under the microscope and look at the lagging indicator provided by the Conference Board of their Leading Economic Index. Here 'tis from mid-2013 through Friday's report for August, which after being at 0.0% in July, came in at a robust 0.1%. But tease that zero line too often and 'twill get taken out. Raise rates? Really?
Recall as well our noting a week ago, with respect to the Fed's inflation target of 2.0%, that the sum of the monthly changes in the Producer Price Index this year-to-date is -0.4%. And if we peek across the pond, why looky there: EuroZone inflation "unexpectedly" weakened in August to 0.1%, such that the European Central Bank may have to spin its funny money tumblers so as to buy even more bonds. Meanwhile, 'tis said China's yuan shall further fawn before next year's dawn. What to do?
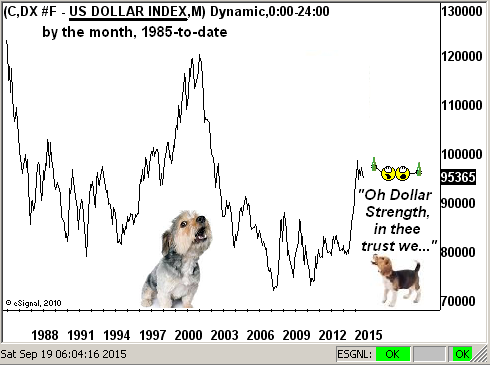
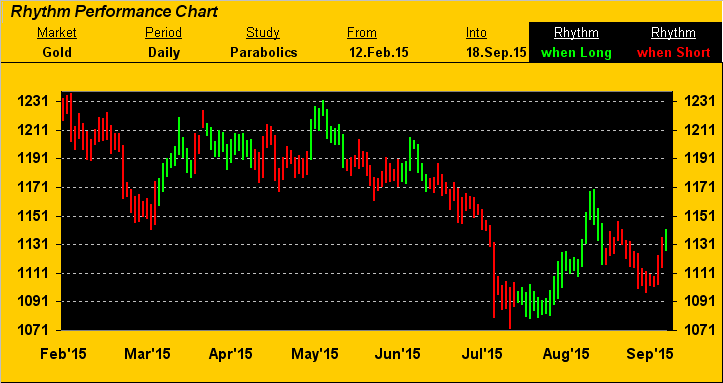
Comforting to know there's a currency alternative to the Doggie dollar: Gold. And with its "Lift-Off", we've next the following chart of daily bars since February. When the daily parabolic trend is Short, the bars are red, else green if Long.
Look at what just happened, (rightmost bar). Moreover, the buying interest during the prior green stint is the best across the chart, and with price not then having fully succumbed (for once) through the ensuing red bit, this new green bar augurs well for an up move to at least test that last green peak at 1170:
Now let's zoom in on the last three months of daily bars in the following dual-panel graphic of Gold on the left and Silver on the right. The "Baby Blues" are the dots depicting the consistency of the 21-day linear regression trend at each day's end. Note that the dots just hitched up yesterday for Gold, but for Silver, they've of late already been well on the move:
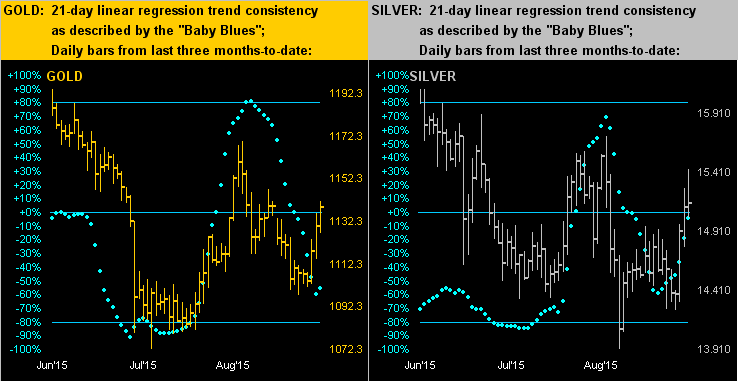
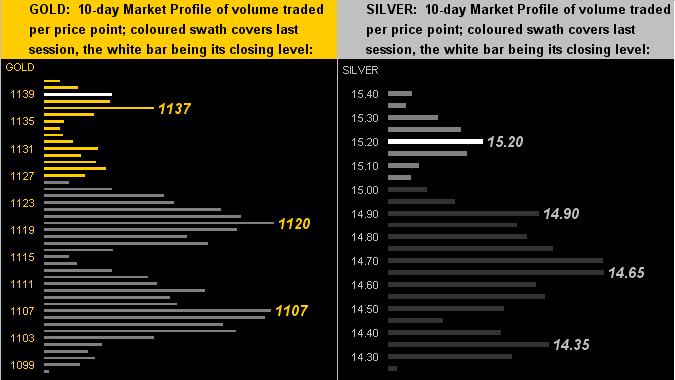
In fact, from their respective low prices for this year, (indeed the lowest points on the above two panels), not only is Gold now +6.2%, but Sister Silver is +8.9%: when she's up and runnin', get on board or get outta the way! 'Course, the Precious Pair are sporting quite the supportive Market Profiles that we next below see as comprised from the last 10 trading sessions, the white bars being Friday's settles:
Toward closing, be it truly "Lift-Off" for the yellow metal, or just another fleeting firework, 'tis nice to have Gold not residing at the very foot of its stack as we see here:
The Gold Stack
- Gold's Value per Dollar Debasement, (per our opening "Scoreboard"): 2552
- Gold’s All-Time High: 1923 (06 September 2011)
- The Gateway to 2000: 1900+
- The Final Frontier: 1800-1900
- The Northern Front: 1750-1800
- On Maneuvers: 1579-1750
- The Floor: 1466-1579
- Le Sous-sol: Sub-1466
- Base Camp: 1377
- Year-to-Date High: 1307
- Neverland: The Whiny 1290s
- Resistance Band: 1240-1280
- The 300-day Moving Average: 1202
- The Weekly Parabolic Price to flip Long: 1148
- 10-Session directional range: up to 1141 (from 1098) = +43 points or +4%
- Trading Resistance: (none, market profile basis)
- Gold Currently: 1139, (weighted-average trading range per day: 15 points)
- Trading Support: 1137 / 1120 / 1107
- 10-Session “volume-weighted” average price magnet: 1116
- Year-to-Date Low: 1072
In signing off for this week's missive, we've these three brief notes:
1) How's this for the Headline of the Week on Thursday from our good friends over at USA Today: "Futures lower as investors bet Fed won't raise interest rates"; for the prior three days, media thinking (oxymoron) was the futures being higher on the same bet.
2) Making the rounds is the fad of the Lazy "set it and forget it" Portfolio of cheap buy-and-hold funds; in the "how to" section, there's nothing about handling a 50% market correction.
3) And finally to the man for all seasons, he who is running so much from real estate empires to running for President, we saw this headline verbatim: "Trump sells Miss Universe"; surely he's not moonlighting as a "Nix it right there, mmb!" Quite right, Squire. We doubtless shan't go further with that one.
What certainly does appear poised to go further is Gold. Simply pierce that 1148 parabolic in the new week and 'twill set the stage for even higher levels, our analysis as noted pointing to at least 1170. "We have Lift-Off!"