On December 16, 2008, in the closing act of a 30-year bull market in bonds, the Federal Reserve’s Open Market Committee (FOMC) did something without precedent. They cut their target for the federal funds rate to between 0% and 0.25%, its lowest level on record and where it has remained the seven years since.
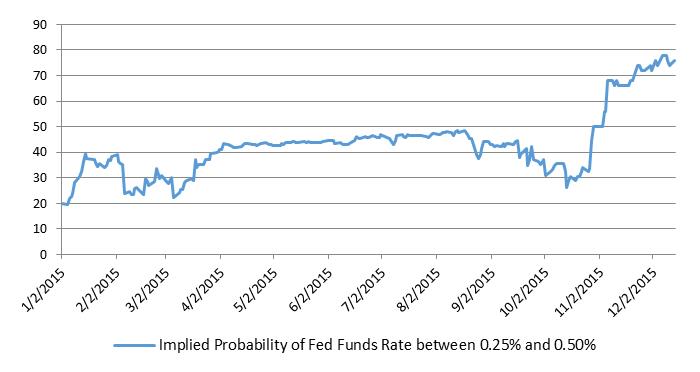
We now approach the Fed’s December meeting with the potential for liftoff as strong as ever. Federal funds futures, as depicted in the chart below, imply a probability of over 80% that the FOMC will vote to increase interest rates.
Implied Probability of Rate Hike at December FOMC Meeting (1/2/2015 - 12/14/2015)
Source: Bloomberg LP
A hike would mark the first time since 2006 that the target for the federal funds rate has increased. In this new and unfamiliar environment, it is critical for investors to understand what forces drive interest rates and recalibrate investment strategies for profitability moving forward.
Why are interest rates so important?
The federal funds rate is the base rate in the US economy. It is considered risk-free and sets the level, or spread, off of which all other interest rates are priced. As such, the federal funds rate is the primary monetary policy tool used by the Fed in its dual mandate to manage employment – by extension growth – and inflation in the economy.
Falling interest rates encourage institutions, individuals, and other participants in the economy to take financial risks. These come in the form of lending when banks issue loans to achieve higher than risk-free returns, and similarly through borrowing by companies for large-scale capital expenditures and individuals who take out mortgages to buy new homes.
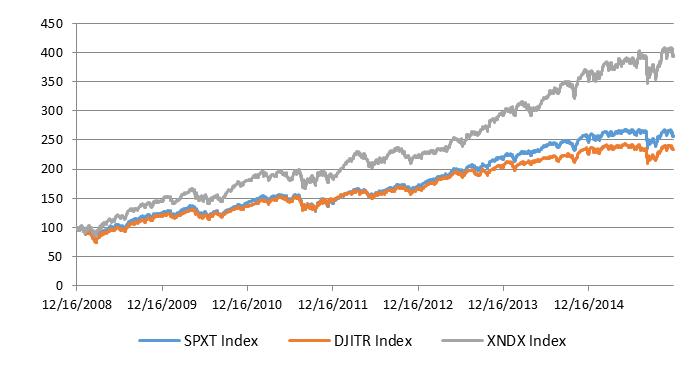
Over the past seven years, low rates had a substantial positive effect on the returns of riskier assets, such as stocks represented in the figure below. In 2014, the S&P 500 registered its sixth straight positive year, bringing its return to more than 159% for the period.
Equity Index Returns (12/16/2008 - 12/14/2015)
Source: Bloomberg LP
Government bonds, on the other hand, faced stronger headwinds as yields were range-bound over the same timeframe. As of this writing, 10-year US Treasuries are set to return just 2.23% annually for the length of their term, making future prospects equally bleak.
The recent run of performance for risky assets combined with a structurally low risk-free rate has left investors looking for answers not available in instruments themselves. Instead these are found in the underlying forces that drive interest rates in the economy.
Economics of the Yield Curve
Federal funds represent the rate on overnight borrowing, and their future path can be bootstrapped using short, medium, and long-term government bonds. While additional risk factors affect the shape of the yield curve, its basic tie to borrowing and lending remains important to the function of the economy.
Like federal funds, the yield curve’s moves are driven by changing expectations for growth and inflation. When expectations for these factors rise, so too do those for rates which, holding other factors constant, has a negative impact on the price of bonds.
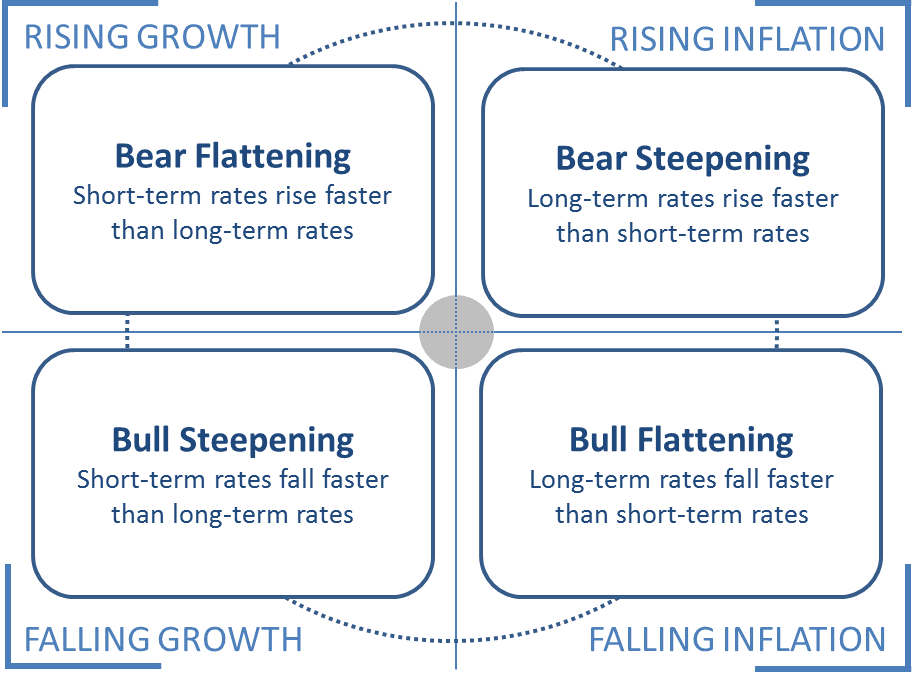
With yields at historic lows it is increasingly difficult to profit from traditional, long-biased strategies. Relative value positioning across the curve, however, offers an alternative source of returns whereby profits are possible regardless of parallel shifts in yield. The schematic below provides a framework for investors’ positioning using economic inputs. It is designed for spreads between short and long-term government bonds instead of simply parallel shifts in yield.
Economic Drivers of Yield Curve Steepening & Flattening
Source: Wavelength Capital Management
In this context, the curve’s front end is influenced most by changing growth expectations – these are more immediate and have shorter-term policy implications. The back end of the yield curve is influenced more by expectations for inflation which take longer to manifest themselves in economic data.
Changing spreads between different points on the yield curve offer profitable opportunities for long / short positioning. Both bull and bear forces drive this steepening and flattening, and at the core of changes in the yield curve’s shape are economic expectations.
Interest rates are the backbone of financial markets and the economy, and as we enter a new environment it is important to understand what drives them. Growth and inflation, while always changing, are consistent in their impact, and when unfamiliar risks overwhelm markets relative value opportunities can be pursued based on this fundamental understanding.
