Generally speaking, the stock index futures markets stumble into October
The last week (or so) of September is notoriously weak for equities, and strong for Treasuries. We don't see any reason to buck the seasonal trend. After all, Friday's bloodbath on Wall Street is a sure fire sign that investors have not gotten over the mid-August stock market "crash".
Although the Fed meeting is behind us, we still have to worry about the details of Janet Yellen's speech on Thursday at the University of Massachusetts-Amherst. Oddly enough, the financial markets sometimes react to non-FOMC speeches than they do the official Fed meetings. Be prepared for volatility.
Treasury Futures Markets

No mercy for bond traders
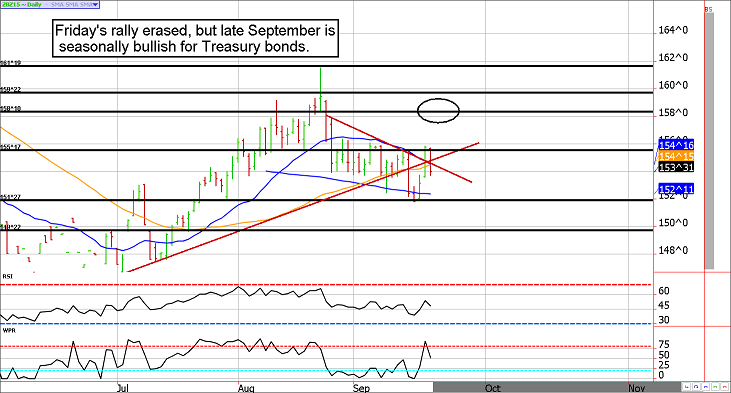
The bond market is playing a treacherous game of switchback; those on the wrong side on the wrong day are paying for the error dearly. Going into the weekend we were all but certain the 30-Year bond would break through resistance in the mid 155s, and make its way into the high 150s. However, today's trade is telling the opposite tale.
If the trading range continues to guide trade, the December ZB could traded back into the mid 151 area. If you are a bull, that will be the area to start getting interested again. If history repeats itself, the path of least resistance for Treasuries should be higher in the coming weeks.
Treasury Futures Market Analysis
**Bond Futures Market Consensus:** We'd rather be bulls than bears due to seasonal tendencies and a shaky equity market, but failure at the top of the range leaves prices vulnerable to a slide back to the mid-151s.
**Technical Support:** ZB : 151'14 and 149'22 ZN: 126'16, 125'30, and 125'17
**Technical Resistance:** ZB : 155'17, 156'26, 158'10, and 159'22, and 161'16 ZN: 127'30, 128'20 and 129'17
Stock Index Futures
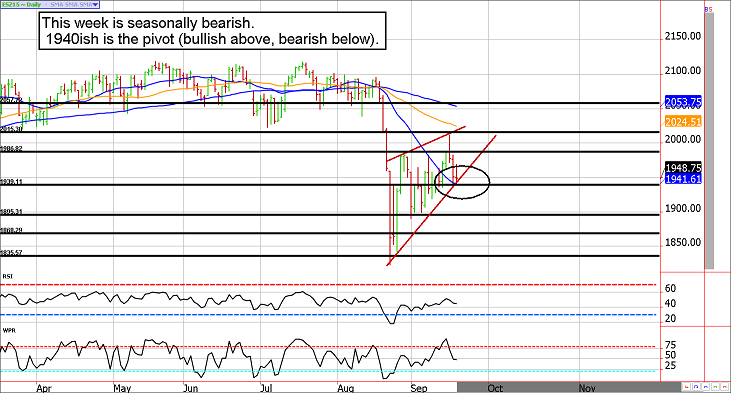
If history has anything to say about it, the ES should be a "sell the rallies" market going into month end.
According to the Stock Trader's Almanac, Monday through Thursday of this week is statistically bearish (meaning there is a 40% or less chance of a positive close). Specifically, on Wednesday, the stats suggest the market has closed positive a mere 28% of the time. Thus, the bears will likely have an edge for the time being.
From a chart perspective; the ES has a major pivot price near 1940. Above this level the bulls have the upper hand, but below it the bears should be in control. It is sure to be a rocky ride, but we believe the odds favor a move below 1940 and perhaps much lower. The mid-to-low-1800s aren't out of the question should the market get a fundamental catalyst.
Nevertheless, if those prices are seen the bulls should be prepared. October is known as the bear killer! Large equity market discounts tend to find sharp and sustainable lows in the month of October.
Stock Index Futures Market Ideas
**e-mini S&P Futures Market Consensus:** We certainly wouldn't be comfortable being bullish here. A break below 1940 might get ugly.
**Technical Support:** 1939, 1895, 1868, and 1835
**Technical Resistance:** 1986, 2018 and 2056e-mini S&P
Futures Day Trading Ideas
**These are counter-trend entry ideas, the more distant the level the more reliable but the less likely to get filled**
ES Day Trade Sell Levels: 1969, 1985, 1997, and 2011
ES Day Trade Buy Levels: 1933, 1921, and 1910
In other commodity futures and options markets....
June 29 - Go long the Aussie dollar via e-micro futures near 7640ish.
July 6 - Add to the bullish Aussie dollar trade with the purchase of another contract (e-micro for most). This dollar cost averages the position to a more favorable level.
August 26 - Sell October euro strangles using the 120 call and the 108 put, for about 56 ticks or $700.
September 3 - Buy back the October Euro 120 calls to lock in gain of about $275 before transaction costs. Sell the October 116 calls for about 30 ticks to bring in more premium and rebalance the trade.
September 9 - Roll the September Aussie dollar e-micro futures into the December contracts.
September 9 - Sell December crude oil strangles using the 58 calls and the 35 puts. We were collecting about $1.00 in premium before transaction costs (or $1,000).
September 16 - Roll euro put from the 108, to the 110 strike. This involves taking a profit of about $200 before transaction fees on the 108 put, and collecting an additional $375 for the 110 put.
September 21 - Buy back Euro 116 call to lock in gain of about $240 before transaction costs.
