Markets and the economy do not need to go in the same direction. Business continues to optimize based on conditions they are seeing. Since the Great Recession, business has done a much better job of adjusting to economic conditions than the masters of the economy have in running the economy.
Follow up:
Business optimization eventually runs out of steam in adjusting to changed conditions IF the economic conditions do not change. This is a contributing factor to the volatility seen in the markets recently.
The role of businesses is to maximize profits. But what happens when you have optimized your company to the crappy domestic and global economy - and sales are flat (or worse)?
Year-over-Year Change - Unadjusted Retail Sales (blue line) and Inflation Adjusted Retail Sales (red line)
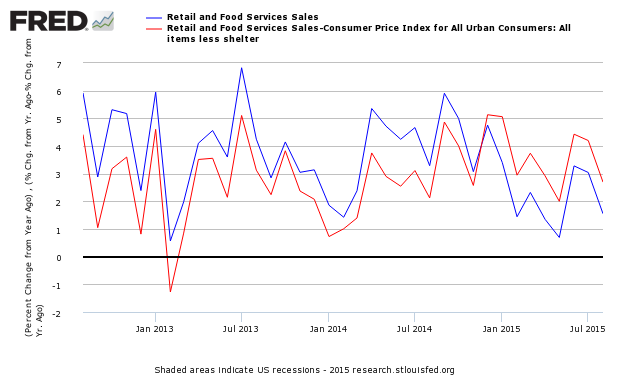
Retail sales have been bouncing around but have been in a general downtrend since 3Q2014. Retail sales per capita seems to be in a long term downtrend (but short term trends vary depending on periods selected - see graph below).
Year-over-Year Change - Per Capita Seasonally Adjusted Retail Sales
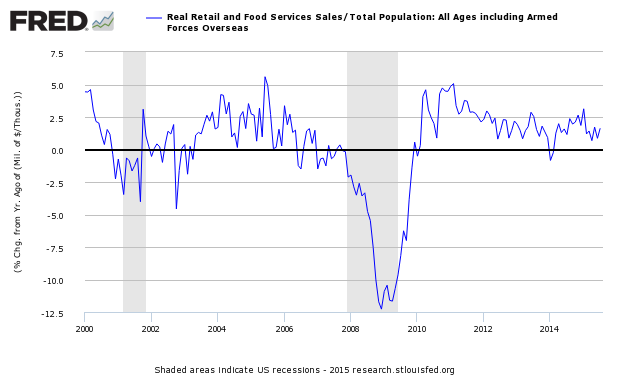
You can only squeeze so much profit out of flat sales. One should note that this is average per capita sales - not median sales. If you have followed my previous posts, my theme remains that the upper income quartile is driving consumer spending, and that the lower income quartiles are not spending more (as their incomes are not growing). Companies like Walmart (NYSE:WMT) will suffer from this phenomenon, BMW will not.
What has happened is that the market valuation has outrun reality.
From Business Insider
Robert Shiller is worried about the stock market.
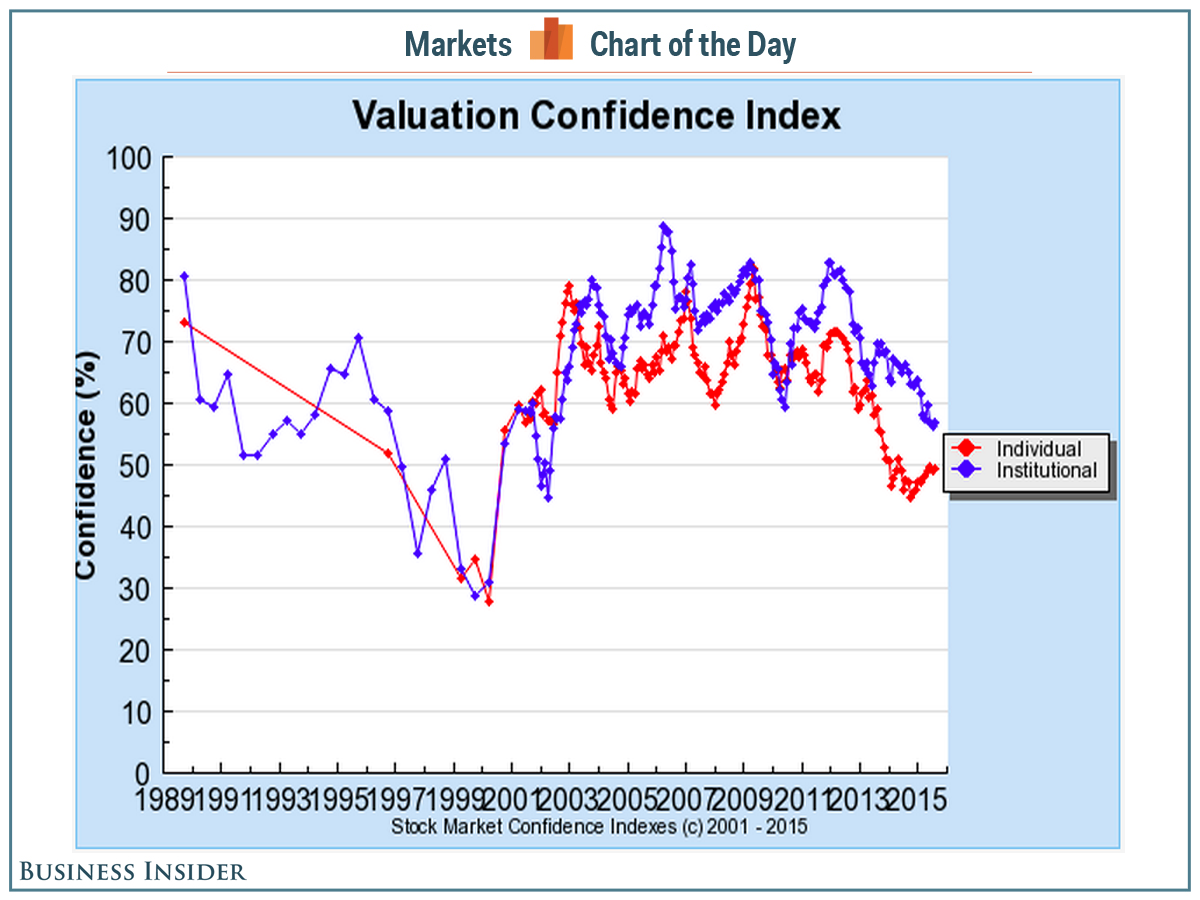
And the Nobel laureate's concern can be summed up in this chart, which shows a steady decline in the valuation of the stock market from both institutional and individual buyers.
This chart shows Shiller's stock market confidence index, which he compiles by asking investors whether they think the stock market is overvalued, fairly valued, or undervalued.
In an interview with the Financial Times, Shiller explains that what worries him about this chart is that the drop in investor confidence corresponds with an increase in the valuation and overall index level of the market.
Said another way, investors keep buying stocks even though they don't really think stocks are, on balance, a good deal. It is, then, something closer to fear than optimism that is fueling the rally in stocks.
I have been an investor and a trader (I like being an investor more as it is less work). Right now, it is hard to find a good home for my zillions of dollars IF I want to keep my investment fairly liquid. If investors lose confidence that the markets will rise - then they will not invest their residual cash.
This makes the coming months a roller coaster for the markets. The markets have overrun valuation - and either (1) time (for growth to catch up to current valuation) or (2) a correction will solve this. It is the role of the boyz to keep the markets from correcting. This is not 2008 - and there is no economic fundamental which suggests economic derailment - it only suggests a soft patch. At this time the market and the economy may well react more in sync - unless they don't.
Although off topic, US Census released its Income and Poverty in the United States: 2014. Anyone with half a brain will understand the implications of this median income graph included in this report.
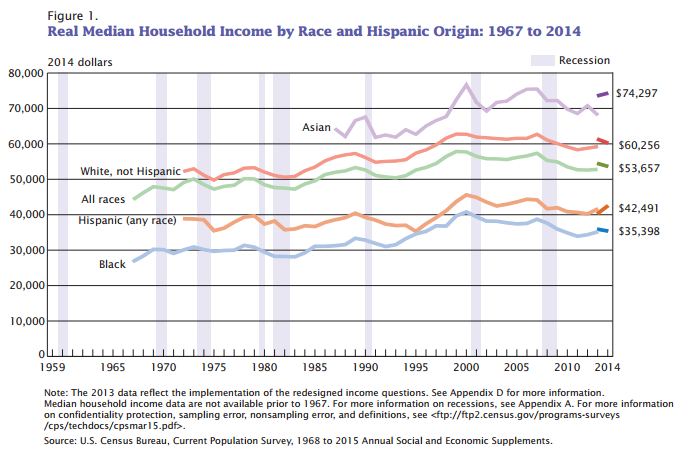
Does anyone really wonder about the cause of an under-performing economy? The average Joe and Jane are doing poorly in the 21st century.
Other Economic News this Week:
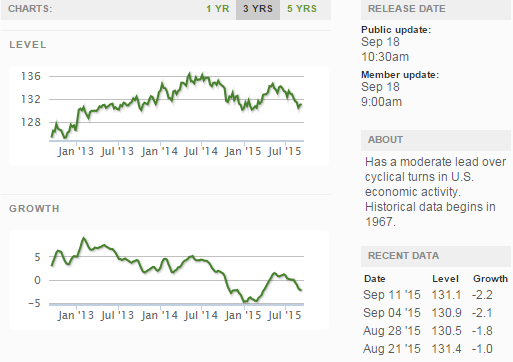
The Econintersect Economic Index for September 2015 improved from last month's lowest index level since April 2010. The tracked sectors of the economy generally improved somewhat or the growth remained unchanged. Still, our economic index has been in a long term decline since late 2014.
The ECRI WLI growth index is now in positive territory but still indicates the economy will have little growth 6 months from today.
Current ECRI WLI Growth Index
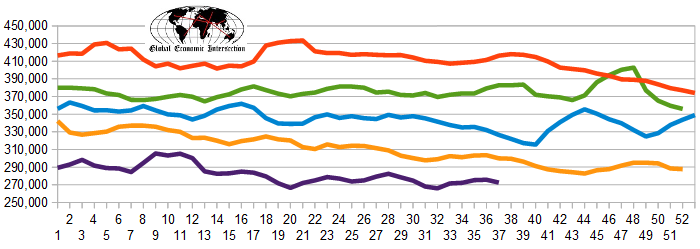
The market was expecting the weekly initial unemployment claims at 270,000 to 280,000 (consensus 275,000) vs the 264,000 reported. The more important (because of the volatility in the weekly reported claims and seasonality errors in adjusting the data) 4 week moving average moved from 275,750 (reported last week as 275,750) to 272,500. The rolling averages generally have been equal to or under 300,000 since August 2014.
Weekly Initial Unemployment Claims - 4 Week Average - Seasonally Adjusted - 2011 (red line), 2012 (green line), 2013 (blue line), 2014 (orange line), 2015 (violet line)
Bankruptcies this Week: Black Elk Energy Offshore Operations, Samson Resources, Privately-held Hovensa
Click here to view the scorecard table below with active hyperlinks
Weekly Economic Release Scorecard:
