The curse of richesor resource curse has been a staple of development economics for decades. The curse refers to the striking fact that many resource rich states, such as Nigeria and Congo, are conflict-ridden basket cases while some of the world’s best performing economies are islands or city-states, such as Japan, Taiwan, and Hong Kong.
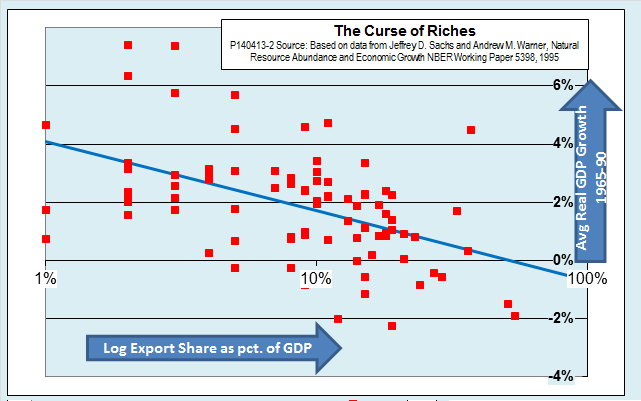
Numerous empirical studies have confirmed the existence of a curse, most famously a 1995 NBER working paper by Jeffrey Sachs and Andrew Warner. Sachs and Warner noted that over the 20-year period from 1970 to 1990, countries with a high percentage of natural resource exports grew systematically slower than did those with few resources. The following chart replots the data from their paper:

Over the years, development economists have suggested several ways in which resource wealth might lead to poor economic outcomes. Two mechanisms seem especially important, one of them focusing on exchange rates and the so-called Dutch disease, and the other on political economy and impediments to social progress. This post uses the recently released Social Progress Index (SPI) to shed new light on their relative importance.
Exchange rates and the Dutch disease
The Dutch disease links resource wealth to poor economic performance via the tendency of resource exports to cause exchange rate appreciation. As a country’s currency strengthens, its manufacturing and agriculture become less competitive on world markets. At the same time, producers of goods for local markets face competition from increasingly cheap imports. The phenomenon gets its name from the decline of manufacturing and farming in the Netherlands in the 1960s following that country’s discovery of off-shore natural gas.
There is no single measure by which we can say that a country’s currency is absolutely overvalued or undervalued, but there are ways to make some relative estimates. One of the simplest is to compare a country’s per capita GDP, measured in U.S. dollars at market exchange rates, with its per capita GDP at an exchange rate that is adjusted for for differences in the relative cost of living, or what economists call purchasing power parity.
For example, Norway has a per capita GDP of something like $100,000 when converted at the market exchange rate of about six krone per dollar. However, the cost of living in Norway is high. When we adjust Norwegian per capita GDP to reflect the relative purchasing power of the krone and the dollar, it comes to only about $55,000. In terms of purchasing power parity, then, we can say that the market exchange rate overvalues the krone by about 80 percent.
In contrast, India’s per capita GDP at the market exchange rate is about $1,500, but the cost of living in India is low. When adjusted to reflect the relative purchasing power of the rupee and the dollar, Indian per capita GDP is about $4,000. In that sense, we can say that the market exchange rate undervalues the rupee.
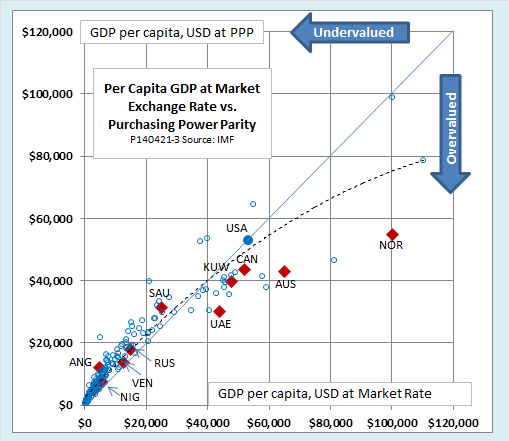
The following chart plots per capita GDP at market exchange rates (horizontal axis) against per capita GDP at purchasing power parity (vertical axis) for all countries in the IMF data base. Countries above the diagonal line have currencies that are undervalued relative to purchasing power parity; those below the line have overvalued currencies. Red diamonds represent eleven large natural resource exporters.

Two things stand out in the chart.
First, we see that the currencies of poor countries tend to be undervalued and those of wealthy countries tend to be overvalued. That phenomenon is familiar to international travelers. To a visitor from the United States, everything in Norway seems expensive. In India, many things—especially services and locally produced goods—seem cheap.
Second, we see that the pattern is more pronounced for the major resource exporters. The dashed line shows the average relationship between the two GDP measures for all countries except the eleven large resource exporters. The exchange rates of the wealthiest resource exporters, like Norway, Australia, and the United Arab Emirates, lie not only below the diagonal line, but also below the dashed curve, showing that they are more overvalued than we would expect based on their level of income alone. Those are the countries that are most vulnerable to the Dutch disease. Poorer resource exporters, like Angola, Venezuela, and Russia, have currencies that are valued about as we would expect, given their levels of per capita GDP.
The political economy of the resource curse
In addition to affecting exchange rates, resource wealth also affects the political economy of resource exporters. In many such countries, the struggle for a share of resource wealth becomes the central focus of politics. That can be harmful in several ways.
Resource wealth creates fertile soil for the growth of political corruption. Those holding political power can not only divert export revenues to their own private accounts, but can also share the spoils with relatives, political supporters, and members of favored ethnic groups.
Since an independent judiciary, a free press, and electoral democracy hinder corruption and rent seeking, their development is neglected or even actively suppressed.
The uncertain and often brief tenure of corrupt officials and their cronies fosters short-term thinking and discourages long-term investment in non-resource sectors, infrastructure, and human capital.
The Social Progress Index is perhaps the best effort to date to quantify these hard-to-measure tendencies. Unlike many other broad indexes of prosperity, the SPI aims to measure social outcomes rather than economic inputs. It excludes direct economic variables such as exchange rates and the level and growth rate of GDP, which are the drivers of the Dutch disease. Instead, it focuses on variables that are critical to political economy—press freedom and internet access; investment in human capital through education and healthcare; tolerance, personal freedom, and property rights.
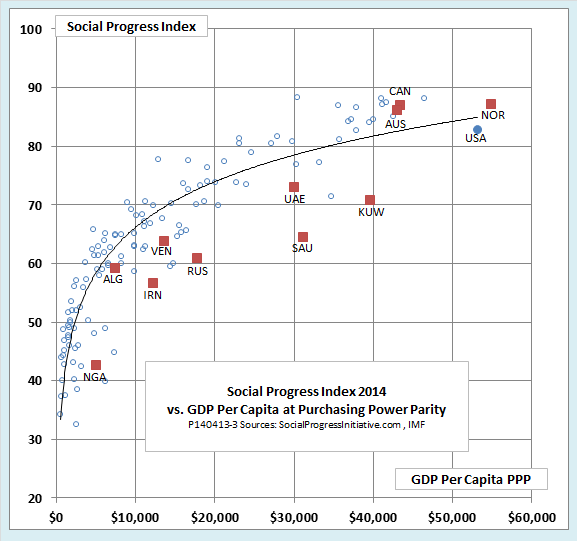
The SPI is positively but not tightly correlated with real GDP per capita. As the next chart shows, there are many outliers from the GDP-SPI relationship, among them, many large resource exporters.

The trendline in the chart shows the average relationship for non-resource countries between the SPI and per capita GDP at purchasing power parity. Note that nearly all of the resource rich countries fall well below the curve. Resource wealth has made those countries rich in terms of GDP, but it has not brought as much broader social progress as equivalent levels of GDP have brought elsewhere.
The conspicuous exceptions are Australia, Canada and Norway. What they have in common is that they developed the institutions of democracy and civil society before natural resource exports made them rich. Furthermore, the early economic growth of these countries came, in part, from exports of products of their farms, forests, and fisheries. Although those exports are resource-based, they are not what development economists call point-source natural resources. Rather than being dominated by one or a few private or state-owned corporations, farm, forest, and fishery exports are the products of thousands of individual farmers and small businesses. Corrupt officials cannot easily capture the rents from those sectors. For that reason, they provide a much more solid institutional base for prosperity.
Conclusions
Our charts confirm idea that natural resources, especially point-source natural resources like oil and ores, can be as much a curse as a blessing. They also suggest that the way in which the curse operates differs from one country to another.
For high-income resource exporters, the Dutch disease poses the greatest threat. The currencies of those countries are strongly overvalued, as measured by the ratio of GDP at market rates to GDP at purchasing power parity. Lower-income resource exporters have exchange rates that are valued about as we would expect, given their levels of GDP per capita.
Among lower-income resource exporters, political economy plays a bigger role. For them, the added GDP generated by resource exports does not translate into better outcomes for indicators like public health, education, access to information, and personal freedoms. Social progress and resource wealth seem to be compatible only for a handful of countries that developed strong institutions of democracy and civil society before they became major exporters of point-source natural resources.
Where does that leave the United States, represented in our second and third charts by a large blue dot? How has it managed to escape the curse of riches, despite being richly endowed with natural resources and despite being the world’s fifth-largest natural resource exporter?
Part of the reason is that many of its commodity exports, especially farm and forestry products, do not fall in the point-source category. Also, like Norway, Canada, and Australia, the United States became democratic before it became rich. But probably the most important reason that the United States has escaped the resource curse is that most of its natural resources are produced and consumed at home. Despite their large absolute volume, resource exports account for only 11 percent of all U.S. exports, compared to 78 percent for Norway, 61 percent for Australia, and 39 percent even for Canada. That is probably the reason that, as our second chart shows, the United States is the only major, wealthy resource exporter whose currency is not significantly overvalued relative to purchasing power parity. In fact, going by the trendline in our chart, the U.S. dollar is slightly undervalued. That ensures that the industrial, technological, medical, and agricultural goods that dominate U.S. exports remain competitive on international markets.
