
The chart below shows a clear divergence in trends of the total loans and leases on U.S. banks' balance sheets, and the broad money supply measure (M2). Loan balance growth is slowing, while the money supply keeps growing at a steady rate of approximately 7%.

This is sufficient enough for some economists nightmares. That's because they may view this divergence as a violation of principles they hold dear. Many still believe that bank loan balances and M2 money supply have to be tightly linked, as the creation of deposits is entirely tied to lending. The chart shatters that belief.
But in spite of the divergence in the chart above, the "loans create deposits" axiom still stands - deposits are still created through bank credit. What's at play here is shadow banking. Two key developments explain much of this divergence without violating these principles.
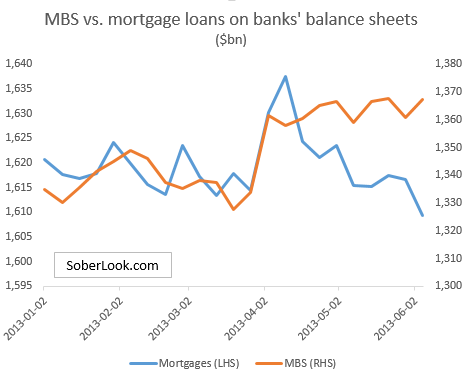
1. Loans on banks' balance sheets do not represent the entirety of credit creation. Loans originated by banks increase deposits, but banks often sell some loans into the shadow banking system, such as Fannie and Freddie. A material portion of these mortgages then ends up back on banks' balance sheets in the form of Agency MBS. These securities are exempt from the Volcker Rule, allowing banks to hold substantial amounts. That process reduces total loan balances without reducing deposits, contributing to the divergence in the chart above.
2. As discussed before, M2 includes another form of shadow banking - retail money market funds. These funds have seen their AUM rise recently due to increased risk aversion, particularly in fixed income (please refer to last chart in this post). That development has added to M2 growth without increasing loans on banks' balance sheets.
So our friends in the economics profession should be able to sleep well at night. The divergence between the trajectories of M2 money supply and bank loan balances has explanations that do not violate key principles of money creation.
This is sufficient enough for some economists nightmares. That's because they may view this divergence as a violation of principles they hold dear. Many still believe that bank loan balances and M2 money supply have to be tightly linked, as the creation of deposits is entirely tied to lending. The chart shatters that belief.
But in spite of the divergence in the chart above, the "loans create deposits" axiom still stands - deposits are still created through bank credit. What's at play here is shadow banking. Two key developments explain much of this divergence without violating these principles.
1. Loans on banks' balance sheets do not represent the entirety of credit creation. Loans originated by banks increase deposits, but banks often sell some loans into the shadow banking system, such as Fannie and Freddie. A material portion of these mortgages then ends up back on banks' balance sheets in the form of Agency MBS. These securities are exempt from the Volcker Rule, allowing banks to hold substantial amounts. That process reduces total loan balances without reducing deposits, contributing to the divergence in the chart above.
2. As discussed before, M2 includes another form of shadow banking - retail money market funds. These funds have seen their AUM rise recently due to increased risk aversion, particularly in fixed income (please refer to last chart in this post). That development has added to M2 growth without increasing loans on banks' balance sheets.
So our friends in the economics profession should be able to sleep well at night. The divergence between the trajectories of M2 money supply and bank loan balances has explanations that do not violate key principles of money creation.