As we put pen to paper in composing this, the 250th consecutive Saturday edition of The Gold Update, my thanks once again to all of you valued readers and to those of you who've diligently linked to these many missives over the last five years. We haven't always been right, but for our belief in Gold 2000, we wouldn't write. 'Tis coming, and herein at the conclusion of this week's milestone edition we present our best calculation yet that puts price at $2000 today.
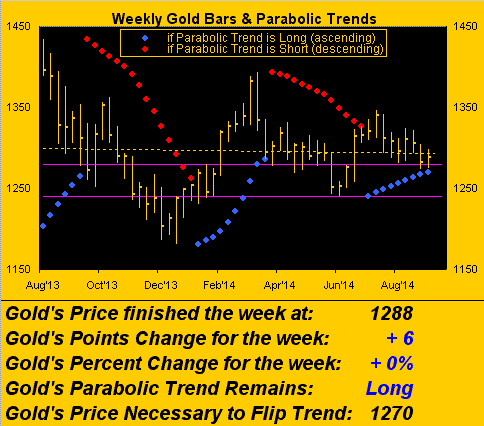
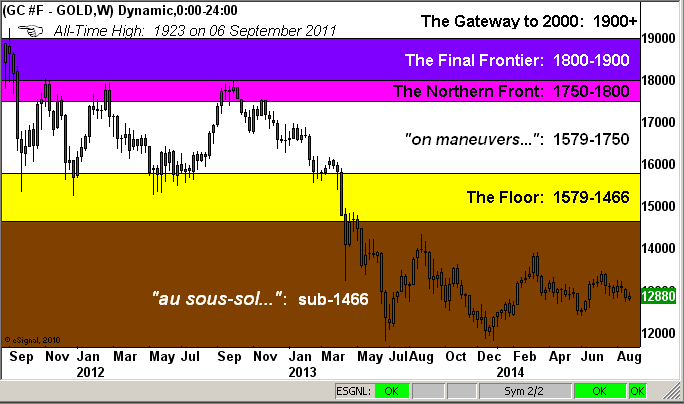
The reality check is that Gold today is not at 2000, rather 'tis at $1288 in closing out the week Friday with the ever-rising parabolic Long trend still intact, albeit homing in on price such that the yellow metal now has very little downside wiggle room with which to work: for to tap 1270 in the ensuing week would flip such trend to Short. Nonetheless for the second week in a row, Gold dipped its toe into the 1280-1240 support zone (between the purple lines) in the following chart of the weekly bars, and then popped back up:
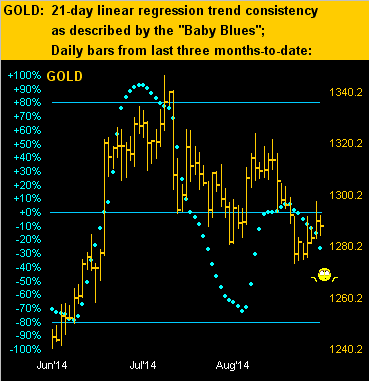
So with Gold having little downside room with which to deal given its present proximity to the rising weekly parabolic Long trend, concern of such trend flipping to Short -- should Gold not put in a robust up week -- is underpinned by the state of Gold's "Baby Blues", the dots in the next chart that define 21-day linear regression trend consistency. This three-month view of Gold's daily bars in tandem with the Baby Blues' gathering steam to the downside would typically point to lower levels ahead:
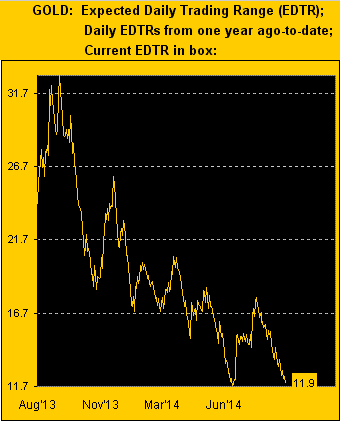
But one thing's for certain: Gold's volatility has really compressed from the daily trading ranges exhibited at this time in 2013. One year ago today, Gold at 1396 was only 8% higher than the present 1288 level, but the expected daily trading range ("EDTR") then was 24 points between the high and low; today the EDTR is just half that distance at 12 points. Here's the track of the EDTR from one year ago-to-date, the recent post-June spike attributable, in part, to "geo-jitters":
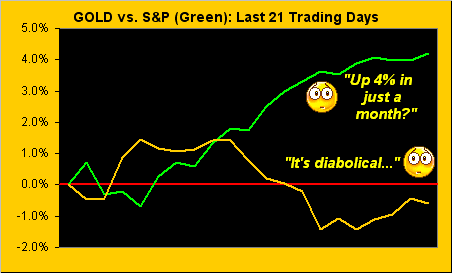
'Course, coincident with the settling in of September typically comes the unsettling of other markets-at-large, and "large" might rightly be the operative adjective for a fall in the S&P, which given that negative correlation is still a key, Gold could well greet with glee:
Moreover, mid-week courtesy of Bloomy Radio, in the wee hours came an analyst noting the price/earnings ratio of the S&P, (having finally surpassed its own 2000), to be 19x. Were it not for the fact that the time here as of this writing was 02:30, I'd have thrown off the covers, snatched up the phone and kindly encouraged them to do the calculation themselves rather than simply parrot what they hear from other sources, (short of getting their famous "terminals" to properly do the math).
Those of you scoring at home know the drill: 'tis simply the summation of 500 factors comprised of each stock's price, divided by its earnings, times its cap-weighting in the Index. (For companies with no earnings, the price of the stock conservatively satisfies as its p/e). Add 'em up and at this writing you'll get 37.3x. Bang.
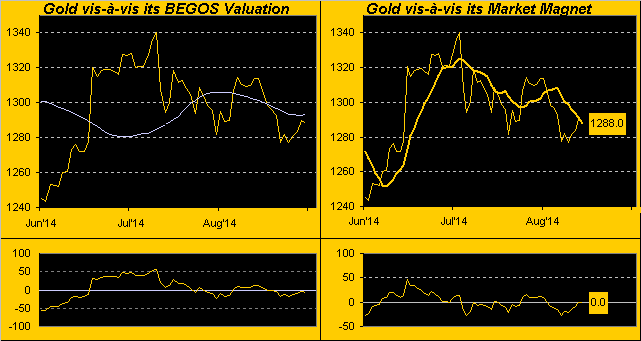
Next let's turn to how Gold is positioned ahead of potentially raucous market weeks if not months to come. In the following two-panel graphic we've matching displays of Gold's daily closes for the last three months-to-date. Specific to the left panel is Gold vis-à-vis its smooth, pearly valuation line that compares price's movement relative to those of the primary BEGOS Markets (Bond/Euro/Gold/Oil/S&P); presently Gold and its valuation line are essentially at the same level, (identifiable as well by the oscillator at the foot of the chart: price less valuation). Specific to the right panel is Gold vis-à-vis its Market Magnet which is the thicker line defining the 10-session contract volume-weighted price for each day; and as you can see, Gold and its magnet are identically at 1288. Therefore, Gold is in sync with both of these measures, almost as if poised at the start/finish line at a racing circuit in anticipation of the green flag to thus put the pedal to the metal:
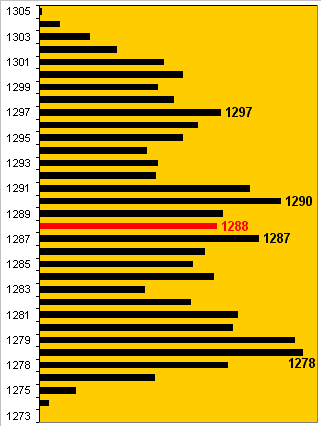
With further respect to the Market Magnet in the right-hand panel above, here is the current presentation from the data that ultimately drive the magnet: our 10-day Market Profile per the trading volume per price point, with the week's settle (red bar) of 1288 nicely nestled smack in the center of the entire trading range:
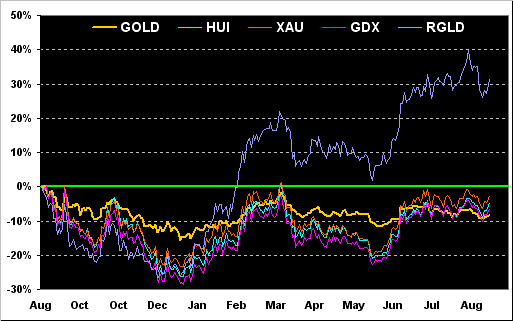
Notwithstanding being near-term stuck between support and resistance, another trading month has concluded and thus 'tis time to compare Gold's year-over-year percentage price track alongside the usual cast of characters, namely the Gold Bugs Index (HUI), Philly Exchange Precious Metals Index (XAU), the exchange-traded fund for the miners (Market Vectors Gold Miners (ARCA:GDX) and the rollicking royalty company Royal Gold (NASDAQ:RGLD). And as is the norm, the precious metals equities continue to out-pace Gold itself two-to-threefold regardless of direction, (RGLD infinitely so):
And now for this edition's finale: the case for Gold 2000 today. Let's first see where we are contextually by bringing up Gold's Structure and key sectors as defined since achieving the All-Time High on 06 September 2011. Each "candle" in the chart is a week's worth of trading:
To be sure, there are all sorts of overhead broad-based trading sectors of resistance with which to deal, albeit we've seen Gold make a net gain of as much as 70 points in a single session, (+9.0% on 17 September 2008). Either way, since the writing of the first Gold Update back in 2009, through these years we've on occasion made the case that, given Gold is money, it ought be at this price or that price, primarily in: 1) correlation to non-asset supported sovereign money supplies, the increases in which far out-pace any production rate of Gold, and in: 2) dependency upon the point in time from which one makes the calculation. (And please dispense with the prattle about about Gold's being a non-correlated asset; were it so, its price today ought revert back to $35/oz., then further be adjusted for changes in supply and tied to some nominal rate of natural inflation such as that for bubble gum or shoelaces).
Whilst our calculations have comprehensively pointed to higher levels for Gold, we did specifically state in 2011 that price had indeed gotten ahead of itself. So in marking this, our 250th missive with something special, and timely too as would-be vacationing readers emerge from the woods, (or as dear old Dad used to say, as the Great American Sap tows his boat back from the lake with a mile of cars behind him), as they all morph back into reality this StateSide Labor Day weekend, (which in my day meant returning the office in one's tweeds), we now calculate the Gold price as follows:
The Federal Reserve Bank of St. Louis provides M2 money supply data all the way back to 1980. That's the maximum amount of readily available data that we've got and 'tis from there we initiate our calculation. So here we have then, and now:
31 October, 1980
- FRB's level of M2 Money Supply $1.59 trillion
- Price of Gold $642/oz.
- Global Gold Tonnage 94,000
30 August, 2014
- FRB's level of M2 Money Supply $11.48 trillion
- Price of Gold $1,288/oz.
- Global Gold Tonnage 179,000
"Wait a sec, mmb, I already see where yer goin' with this and your $642 from 1980 is way too inflated 'cause Gold was still comin' off that $800 bubble, so yer analysis is bogus man..."
Now just stay with me, Squire, for you're about to yet again see why 'tis I, not you, who makes the responsible effort to go deep inside the numbers, as we're next going to slash that $624 in half.
The Gold tonnage as noted back in 1980 was just 52% of what 'tis today. Which in turn is to say that when you've a lot more of something, 'tis worth a lot less. Therefore, let's dilute the 1980 price of Gold by multiplying it by 52%, et voilà, now our $624 basis is instead reduced to $334, which is less than the average price of Gold from 31 October 1980 through any day since then.
The rest is easy: today, the FRB's level of M2 Money Supply is $11.48 trillion, an increase since 1980 of 622%. Simply multiply such increase by our diluted 1980 Gold price of $334 and we get (roll of the timpani, crash of the cymbals, amidst heavenly choral harmony): $2,077 ... and yet Gold today is but a lowly $1,288. Should one yet opine that our 1980 basis even as diluted for a larger Gold supply today is still too high, as we've pointed out in the past, we're not even incorporating into this calculation the burgeoning faux dough contributions of the BOJ, nor those of the PBC, nor from the BOE, nor even from the ECB, the latter which in 1980 had yet be.
"Yeah, mmb, all that fancy-schmancy stuff aside, that fact is Gold is only $1,288, bud..."
And indeed Squire, as we always assert, price is the truth. To boot 'tis determined by supply and demand. Beyond sovereign banks and private sector prudent purchasing in countries such as China and India, the demand for Gold is vapid. But vapid may well be the minds of those who fear not being in expensive equities, the delusional demand driving stock market indices well up and beyond earnings support as noted earlier. However, when it all comes crashing down -- and 'twill -- consider to where the price of Gold might rise were every brokerage account across the land and 'round the world tuck a little of the precious metal into its mix. For what might price be were 10% of managed portfolios rather than today's 5% (or likely less) therein integrate some Gold? Will you be left on the sidelines? I certainly hope not. Indeed one wonders if the infamous Albert Edwards' notion of Gold topping $10,000 is not so far (literally)-fetched after all.
But for today, let's focus on righting the price to $2,000.
A toast to our valued readers here at No. 250!