I have yet to see a model of the economy which can project future dynamics including accurate projections of productivity, employment, inflation, earnings, peak anything, bubbles, social changes, wars, et al.
Economic models use existing trends and extrapolate to forecast. The surprise in the punch bowl is that economic dynamics are not fixed, and dynamics which align to make an economy flourish in one time period can combine with additional “evil” forces sometime in the future to work against the economy. Take the baby boomers for instance.
Economists saw the acceleration of the economic growth of the late 20th century – and projected this growth into the future. The Great Recession of 2007 might be considered the economic reset from a multi-decade period of high economic growth to a “new normal” of relatively bland economic growth. One of the main contributors to this reset was the baby boomers (a population distortion caused by the end of World War II). The economic argument is that young people starting out in life consume more as they start a family and then work their way to a peak in their career path.
As people age, they begin to see retirement – and as people near retirement, they start to squirrel away assets and money to have more spending power available in retirement. When one retires, less funds are available – so spending is less.
It follows then that increased economic growth can triggered by a slug of young entering the workforce (aka boomers beginning in the late 1960s). The 21st century boomers are not spending like they did at the beginning of their working lives – and the economy is reverting to mean that existed in the late 50s and early 60s after the economic distortions of rebuilding the world healed after World War II.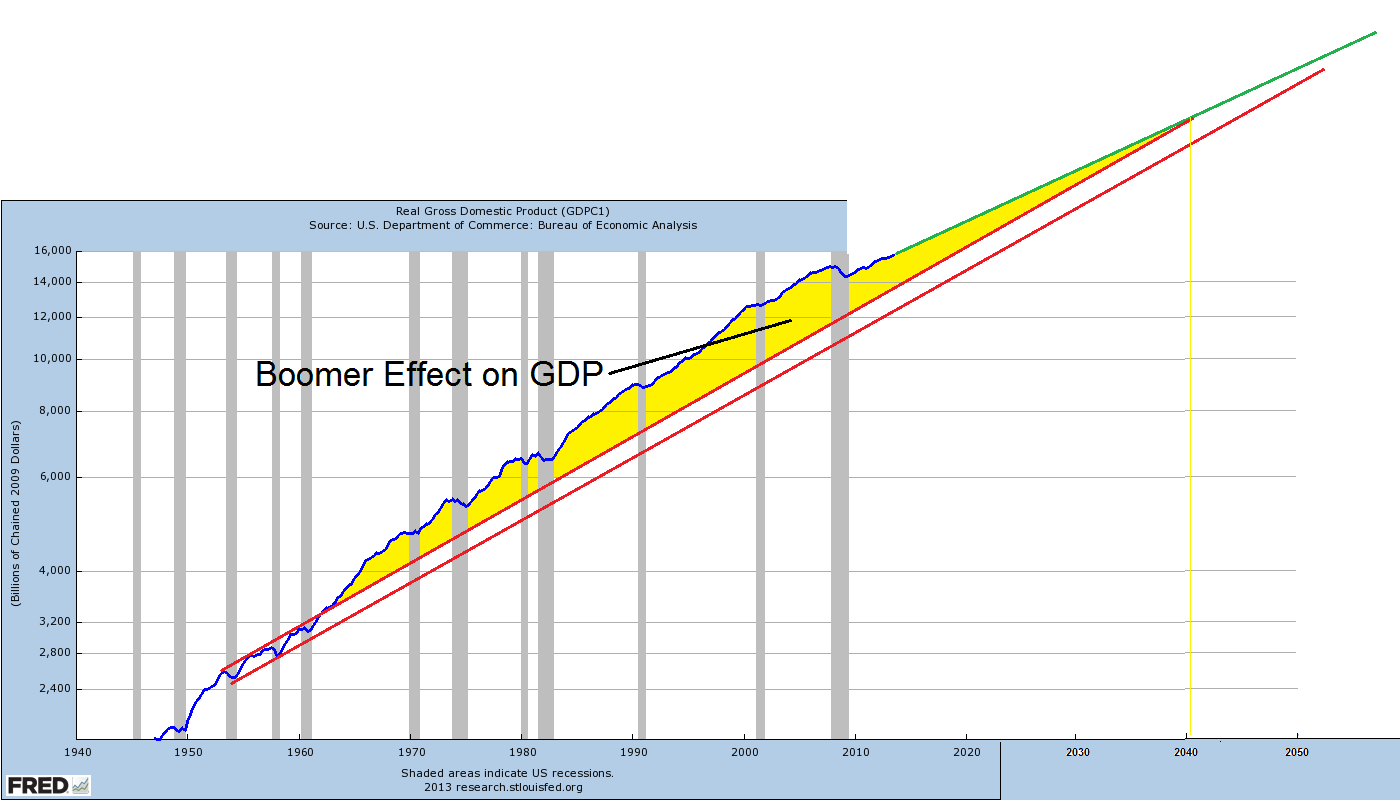
The argument is not as simple as drawing lines on the chart above. I could dazzle with integrations and summations like the economists love to use in their studies. But the truth is that every economic axiom or position requires a set of economic dynamics to maintain defined relationships with each other. There are no definitive tipping points where the wheels could start flying of the economic cart – as the dynamics themselves dissociate or combine with other dynamics to create effects not foreseen in any model.
What I find interesting is the declining birth rate leading into the Great Depression of 1929.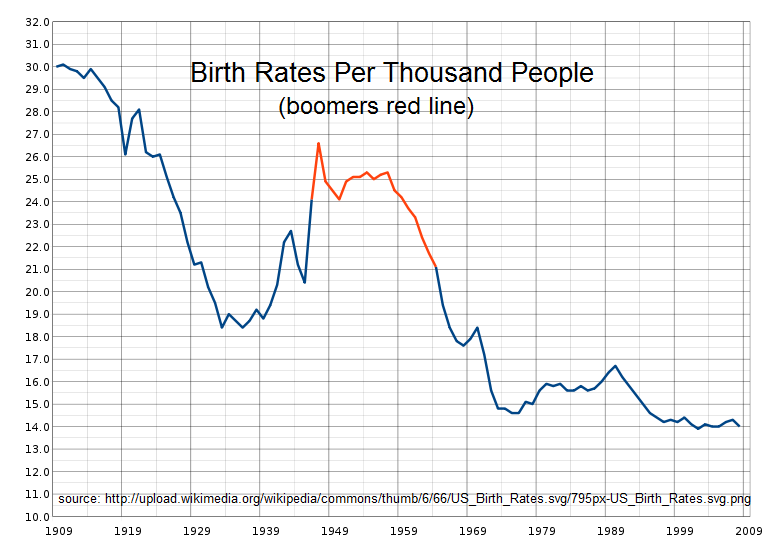
It might be argued that the great birthrate cascade from the beginning of the 20th century to the middle of the 1930s was interrupted by the baby boom and what we have seen in recent decades is simply a continuation to a new bottom in the birth rate. This new bottom has not seen “rescue” and “recovery” such as provided by the baby boom.
An aside: Even a dynamic as obvious as the baby boom with its obvious economic implications can be misinterpreted in a major way. An example of this is the published work of Harry Dent who correctly identified the economic trajectory of the boomers impact. But he ended up on the wrong side of history because the baby boom peak influence that he foresaw for the first decade of the 21st century was swamped by other economic factors that he did not include in his forecasts. His books from 1998-2006 were focused on the booming 2000s with economic problems for the 2010s when the last of the baby boom generation would be transferred into the above 55 age group. He didn’t see the greater forces overwhelming his assumed dominance of demographics, namely the bursting dot.com bubble followed by the housing bubble and the Great Financial Crisis of 2008.
The population does have a lot to do with the economy. It is curious that although the USA birthrate is still declining – the overall population growth is relatively constant. This is influenced by immigration but longevity is also an important factor. People are living longer – and the life span increase produces a swelling of the population in a stage in life of lower consumption (except for health care expenses). Does it make anyone wonder about about longer lifespans being one of the (major?) dynamics producing runaway per capita healthcare costs? 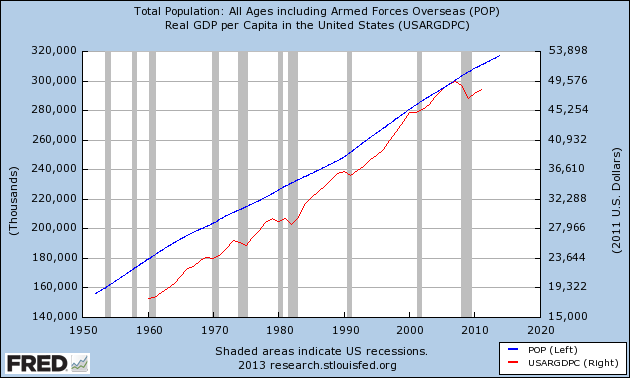
But as share of GDP devoted to health care increases, doesn’t that merely represent a shift in buying preferences? Doesn’t that simply mean that the health care sector becomes a “winner” in the economy as other sectors become “losers”? Isn’t that simply the result of the market forces at which alter we worship?
Of course, many will argue that the market forces involved in health care are not really effective and the efficiency of delivery of that product has been distorted by removal of the basic participants (doctors and patients) from the “marketplace”, which has become dominated by government programs and corporate compensation programs. These have removed effective “control” of the market to insurance companies and government subsidy forces.
And when you become convinced that there is some correlation between population growth / demographics and the economy – you can stare at the below graph for Germany.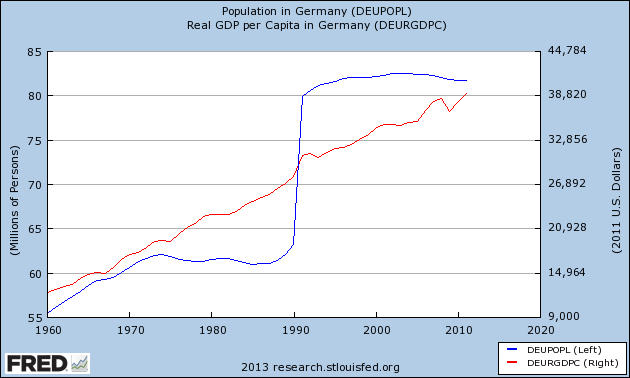
Almost any opinion can be argued as true (or false) in economics. This clearly reflects the primitive level of understanding of the complex dynamics of macroeconomic interactions.
Other Economic News this Week:
The Econintersect economic forecast for December 2013 again improved. What this forecast cannot see is the real effect of austerity and Obamacare – but it does see that business is betting the effects on the economy will be minimal.
The ECRI WLI growth index value has been weakly in positive territory for over four months – but in a noticeable improvement trend. The index is indicating the economy six month from today will be slightly better than it is today.
Current ECRI WLI Growth Index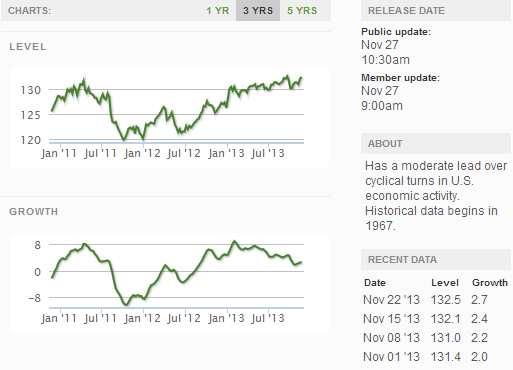
Initial unemployment claims went from 323,000 (reported last week) to 316,000 this week. Historically, claims exceeding 400,000 per week usually occur when employment gains are less than the workforce growth, resulting in an increasing unemployment rate. The real gauge – the 4 week moving average – improved from 338,500 (reported last week) to 331,750. Because of the noise (week-to-week movements from abnormal events AND the backward revisions to previous weeks releases), the 4-week average remains the reliable gauge.
Weekly Initial Unemployment Claims – 4 Week Average – Seasonally Adjusted – 2011 (red line), 2012 (green line), 2013 (blue line)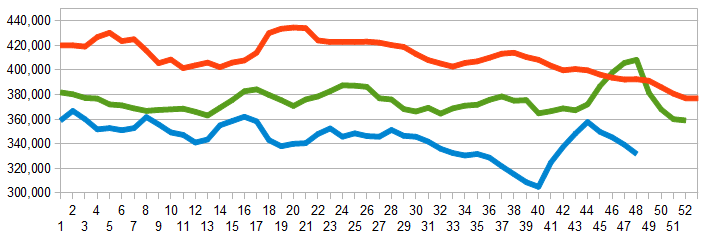
Bankruptcies this Week: Fisker Automotive, Biomoda
Data released this week which contained economically intuitive components(forward looking) were:
- Rail movements growth trend is continuing to accelerate.
All other data released this week either does not have enough historical correlation to the economy to be considered intuitive, or is simply a coincident indicator to the economy.
Weekly Economic Release Scorecard:
Click here to view the scorecard table below with active hyperlinks
