Get 40% Off
👀 👁 🧿 All eyes on Biogen, up +4,56% after posting earnings. Our AI picked it in March 2024.
Which stocks will surge next?
Unlock AI-picked Stocks

The Big 3 Since Their 2000 Highs

Published 06/03/2014, 11:10 AM
Updated 07/09/2023, 06:31 AM

Here is a update in response to a standing request from David England, a retired professor now actively educating investors through his Trader's Eye website. In his presentations, he likes to disprove the standard message of Wall Street, "Don't worry! The market will always come back." I furnished David with some charts, and I now share them with regular visitors to my Advisor Perspectives pages.

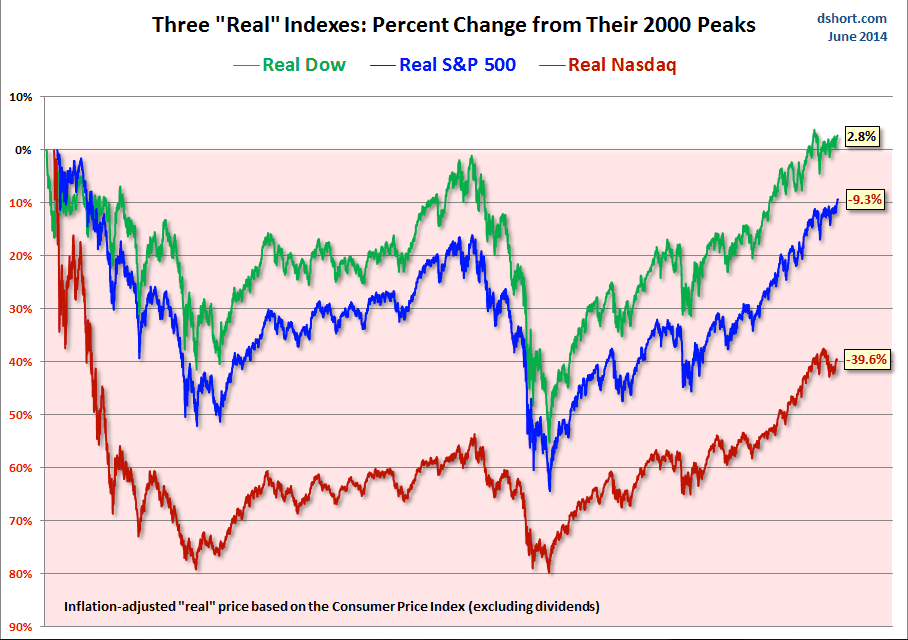
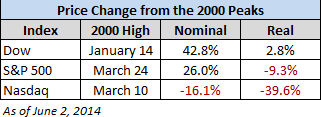
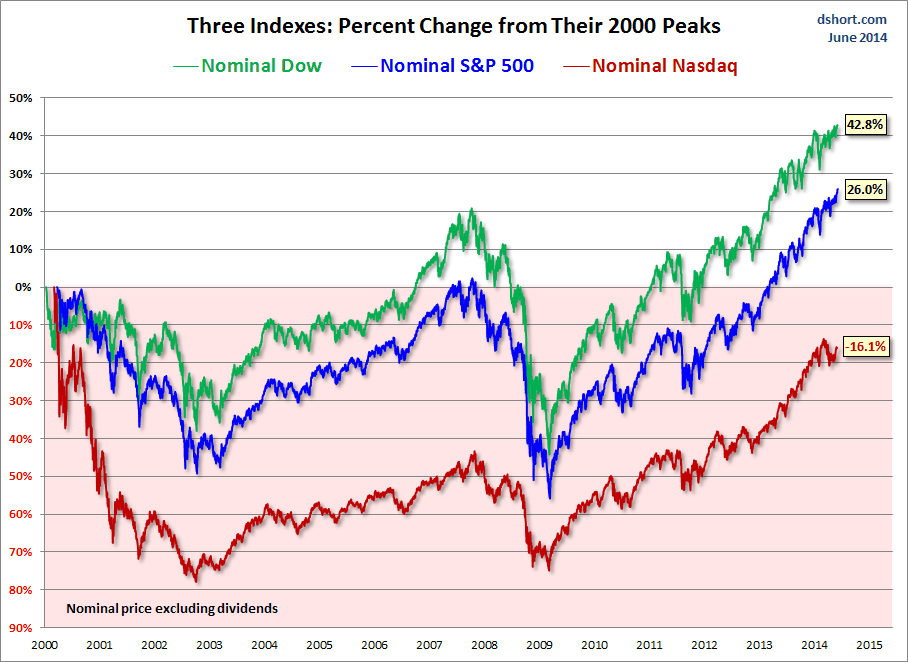
Specifically, David had asked for real (inflation-adjusted) charts of the S&P 500, Dow 30 and NASDAQ Composite. So I created two overlays — one with the nominal price, excluding dividends, and the other with the price adjusted for inflation based on the Consumer Price Index for Urban Consumers (which I usually just refer to as the CPI). The charts below have been updated through today's close.
The Big Three

The 'Real' Big Three

Price Change
The charts require little explanation. So far the 21st Century has not been especially kind to equity investors. Yes, markets usually do bounce back, but often in time frames that defy optimistic expectations.

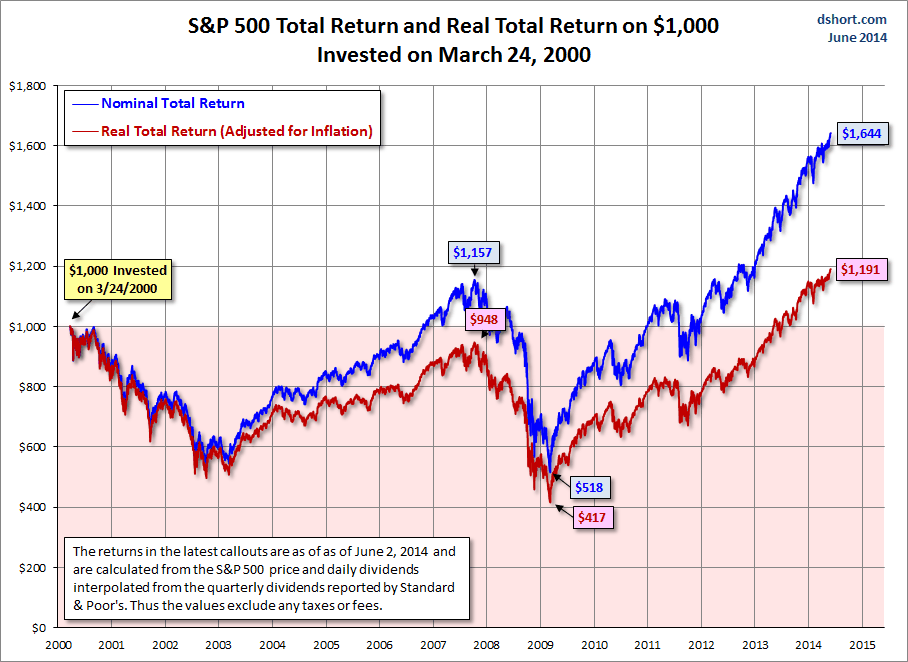
The charts above are based on price only. But what about dividends? Would the inclusion of dividends make a significant difference? I'll close this post with a reprint of my latest chart update of the S&P 500 total return on a $1,000 investment at the 2000 high.

Total/Real return On $1k Investment

Total return, including reinvested dividends, certainly looks better, but the real (inflation-adjusted) purchasing power of that $1,000 is currently, over 14 years later, only 191 dollars above break-even. That equates to a 1.24% annualized real return.

3rd party Ad. Not an offer or recommendation by Investing.com. See disclosure here or remove ads .

Latest comments

Risk Disclosure: Trading in financial instruments and/or cryptocurrencies involves high risks including the risk of losing some, or all, of your investment amount, and may not be suitable for all investors. Prices of cryptocurrencies are extremely volatile and may be affected by external factors such as financial, regulatory or political events. Trading on margin increases the financial risks.
Before deciding to trade in financial instrument or cryptocurrencies you should be fully informed of the risks and costs associated with trading the financial markets, carefully consider your investment objectives, level of experience, and risk appetite, and seek professional advice where needed.
Fusion Media would like to remind you that the data contained in this website is not necessarily real-time nor accurate. The data and prices on the website are not necessarily provided by any market or exchange, but may be provided by market makers, and so prices may not be accurate and may differ from the actual price at any given market, meaning prices are indicative and not appropriate for trading purposes. Fusion Media and any provider of the data contained in this website will not accept liability for any loss or damage as a result of your trading, or your reliance on the information contained within this website.
It is prohibited to use, store, reproduce, display, modify, transmit or distribute the data contained in this website without the explicit prior written permission of Fusion Media and/or the data provider. All intellectual property rights are reserved by the providers and/or the exchange providing the data contained in this website.
Fusion Media may be compensated by the advertisers that appear on the website, based on your interaction with the advertisements or advertisers.
© 2007-2024 - Fusion Media Limited. All Rights Reserved.