Monitoring purposes SPX; Sold SPX on 3/3/15 at 2107.78= gain 2.82%; Long SPX 2/3/15 at 2050.03.
Monitoring purposes gold: Gold ETF(ARCA:GLD) long at 173.59 on 9/21/11.
Long Term Trend monitor purposes: Flat

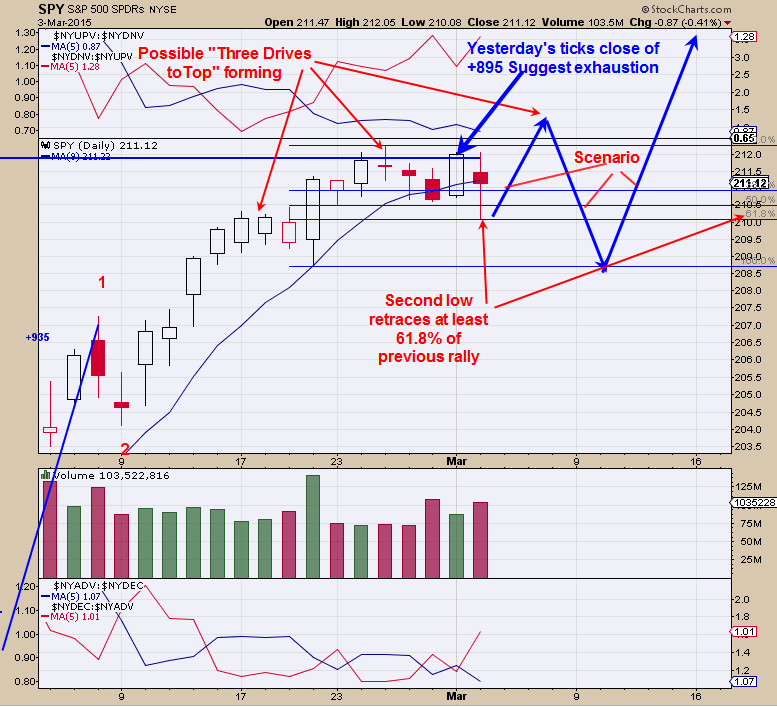
Above is a view that may transpire over the coming days. Monday's closing tick of +895 suggests short term exhaustion for the market and a bearish sign. The pattern that may be forming on the (ARCA:SPY) is a “Three Drives to Top” which predicts a pull back to where the pattern began after the third top is formed.
To help identify this pattern is that the decline off of the second high retraces at least a 61.8% which the current pattern did yesterday. Also the volume should increase to match or exceed the previous lows it broke though on the retracement and this one did. What comes next is a minor new high which volume drops and we will have to wait and see on that. Once the third high is complete the market retraces back to where the pattern began and in this case a pull back near 208 region on the SPY.
To help identify the next low the TRIN should reach above 1.50 and the Ticks reach below -300 and ideally that would come in near the 208 level on the SPY. Option expiration week starts on 3/16/15 and that week normally has a bullish bias. Therefore and Ideal time to look for a low is the week before option expiration week which is next week.

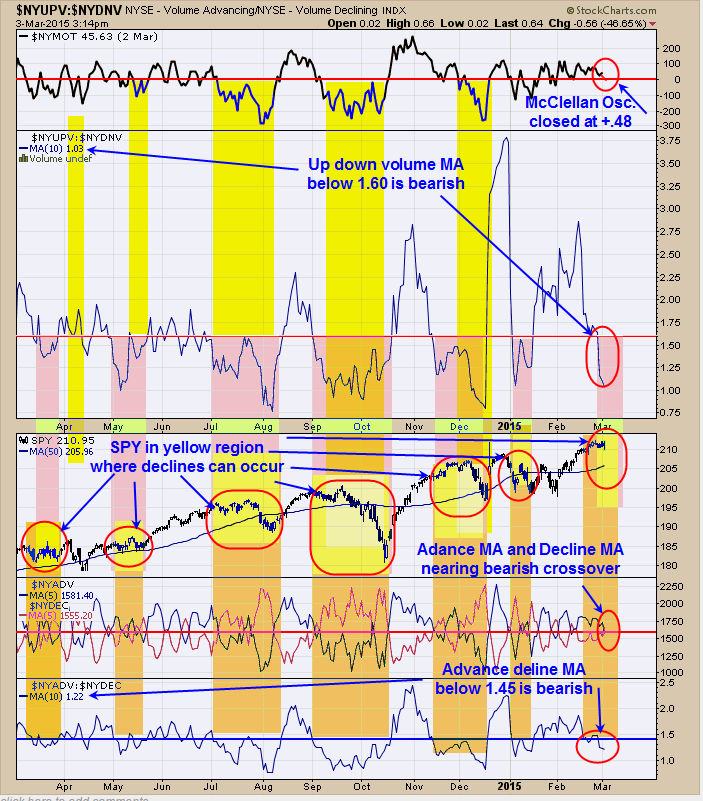
The top window is the McClellan price Oscillator. Tops normally form when the McClellan Oscillator is below “0” and today’s reading came in at +.48 (less than a point above “0” and showing weakness). Next window down is the NYSE up volume/NYSE down volume with 10 Period moving average. It’s a bearish sign for the market when this ratio is below 1.60 and today’s reading came in at 1.03.
The bottom window is the NYSE advance/NYSE declining with 10 period moving average. It has been a bearish sign for the market when this ratio closed below 1.45 and yesterday's close came in at 1.22. Next window up is the NYSE advancing issues with 5 period moving average and NYSE declining issues with 5 period moving average.
These two moving averages are very near producing a bearish crossover but as of yesterday have not crossed. On the SPY window we have colored coded each indicator and when they overlap they produce a yellow color on the SPY chart meaning caution. As you can see the SPY is in the caution yellow area now. Sold long SPX on 3/3/15 at 2107.78 for gain of 2.82%; Long SPX at 2050.03 on February 3, 2015.

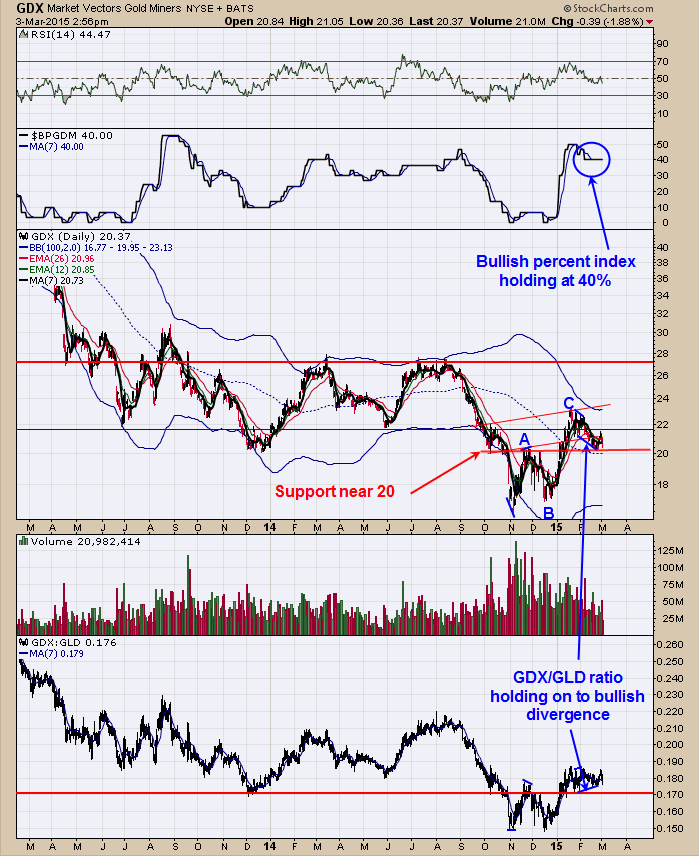
With Market Vectors Gold Miners (ARCA:GDX) consolidating over the last couple of months the Bullish Percent index for the Gold miners have held near the 40% (40% of the stocks in the Gold Miners index are on point and figure buy signals) and shows there is some strength for the Gold miners.
Again GDX has consolidated over the last couple of months and the GDX/GLD ratio is still showing a positive divergence and a bullish sign for longer term. Notice from the low in December, GDX has rallied above the high in November (near 20) and market is falling back to that level and should provide support and we are near that level now. We would expect a bounce to start near current levels possible to test gap level near 22. With the XAU and GDX suggesting ABC patterns and Seasonality not bullish here, a reasonable conclusion is a few more months of consolidation.
