Monitoring purposes SPX: Long S&P 500 on 2/3/15 at 2050.03.
Monitoring purposes GOLD: Gold ETF (ARCA:GLD) long at 173.59 on 9/21/11
Long Term Trend monitor purposes: Flat

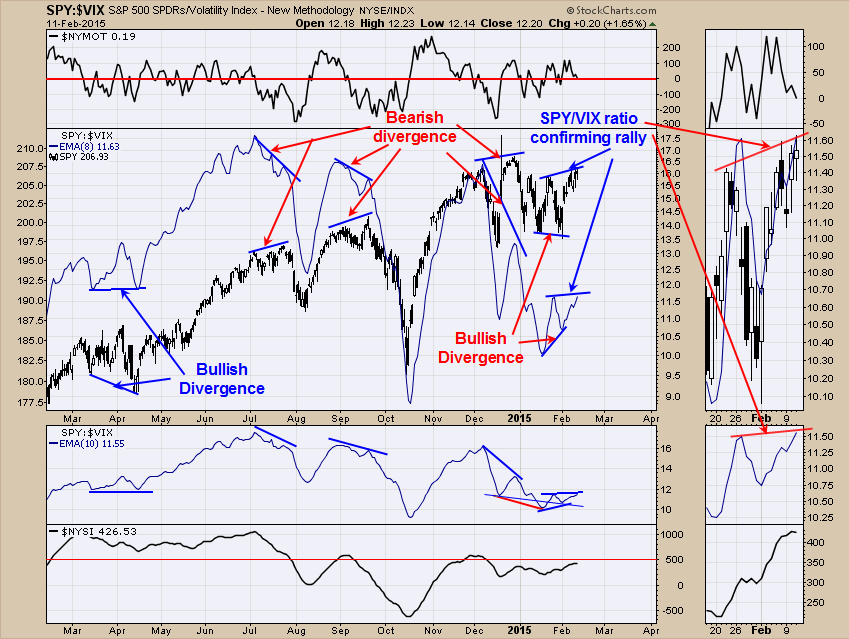
The SPY/VIX ratio has helped to pick turning points in the market by showing a positive divergence and lows (see March April 2014 low and January February 2015 low) and negative divergences at highs (see July; September and December 2014 highs).
Yesterday's market action produced a higher high and the SPY/VIX ratio also made a higher high confirming the uptrend so far. Volume is not great on this rally this week and is cause of concern but would have to say uptrend, though weak is intact. Long SPX on 2/3/15 at 2050.03.

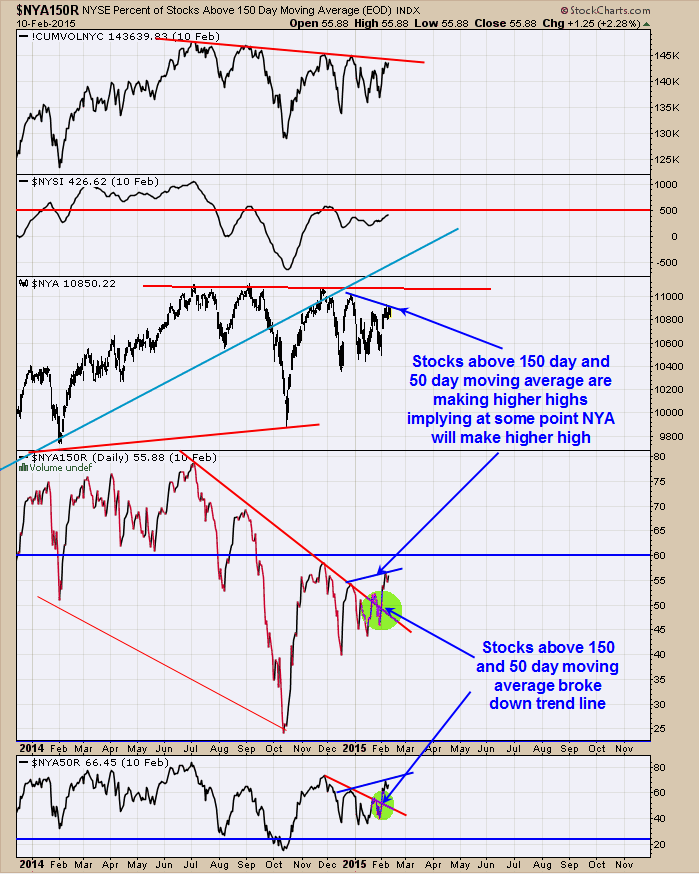
Above chart looks at the bigger picture for the market. The bottom window is the NYSE stocks above their 50 above moving average. The recent rally from the February lows has pushed the stocks above 50 day moving average to 66.45% which is well above the December high reading even though NYSE has not traded above the December high.
This positive divergence suggests at some point the NYSE will break above the December high. Next window up is the NYSE stocks above their 150 day moving average which is a longer term indicator than the stocks above their 50 day moving average.
The stocks above the 150 day moving average is drawing a similar picture to the stocks above 50 day moving average in that it is also above its December high and a longer term bullish divergence. These stocks above their 150 and 50 day moving averages shows the market is getting stronger and at some point will translate into higher NYSE and SPX prices.

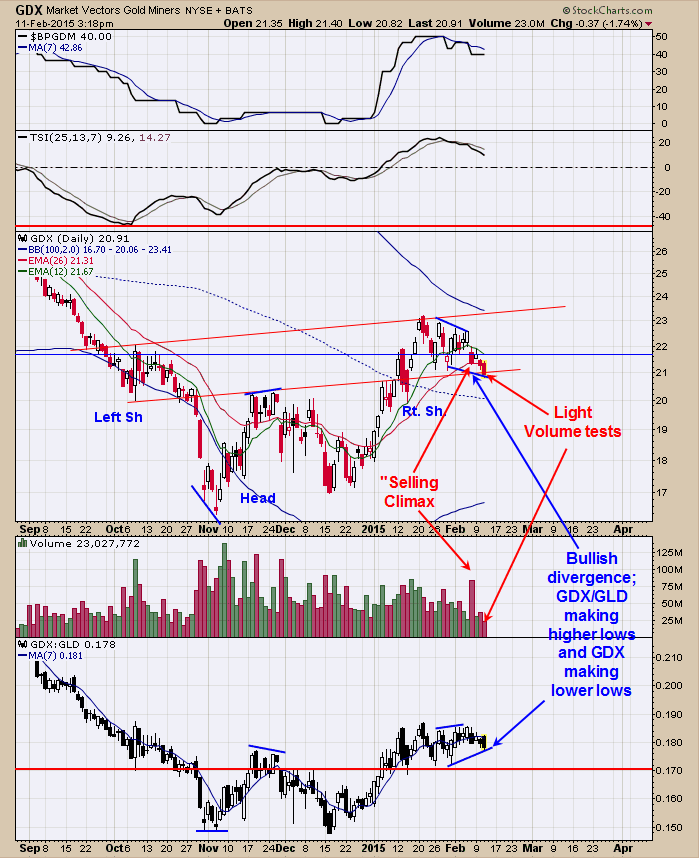
Going into a holiday weekend (Washington Birthday this coming Monday) if a market is declining and volume is dropping (like GDX volume) than it is common for a low to form at the latter end of the week going into the holiday weekend. We did have a “Selling Climax last Friday and GDX has broke below the “”Selling Climax” low on lighter volume suggests a false break down.
Also the GDX/GLD ratio is making higher lows as GDX is making lower lows and a bullish divergence. This setup in the pass has lead to short term rallies. The ideal situation would be for a low to form late this week with a rally next week. Still looking for a rally that may start next week. Stop on GDX at 20.50; long GDX on 1/6/15 at 20.47.
