
If you have ever read any of the enchanting and enduring books by Lewis Carroll, you might be excused for thinking that you had indeed fallen asleep and entered the wonderland world with Alice and joined the Mad Hatters tea party, the White Rabbit and the Queen of Hearts with all the courtiers. After such a week, it is hard to know what is fact and what is indeed fiction, and as always the media is now awash with the doomongers and soothsayers all forecasting the end of the financial world as we know it! But hold on one minute – let’s wake up and return to reality, as did Alice, to find that it was in fact simply a dream.
But where do we begin to delve below the hype and the headlines to make sense of last week’s price action for equity markets, and perhaps the place to start is with oil, which seems to be the hook on which the market makers have hung their hat. It is strange to think that in any other scenario falling oil prices would generally be broadly welcomed resulting in lower production costs and increased corporate profits – simplistic maybe, but nevertheless a fact, and whilst oil is a double-edged sword in the context of inflation, or a lack of inflation, on balance one would imagine this to be good news.

If we start with the UK, it was no surprise to see the FTSE 100 fall and fall hard given the weighting of oil companies in the index, with just two, BP Plc (NYSE:BP) and Shell (NYSE:RDSa), comprising over 14% of the weighting of the index. For the DOW 30 however, the principle energy stock is Exxon (NYSE:XOM) which fell almost 3% on Friday, dragging the index down with it. What was perhaps more interesting however, was the associated price action of the NASDAQ and the S&P 500 and for the former, on the E-mini, until the final hour of trading on Friday, and with the Dow down 250 points, the NQ on the other hand had hardly moved, trading in a narrow range until it too finally capitulated. It was an extraordinary divergence given the market sentiment at the time and indicative of the fantasy world that we are witnessing at present, where one commodity, which has no previous close correlation to risk, is now apparently the driver of sentiment. Strange indeed.
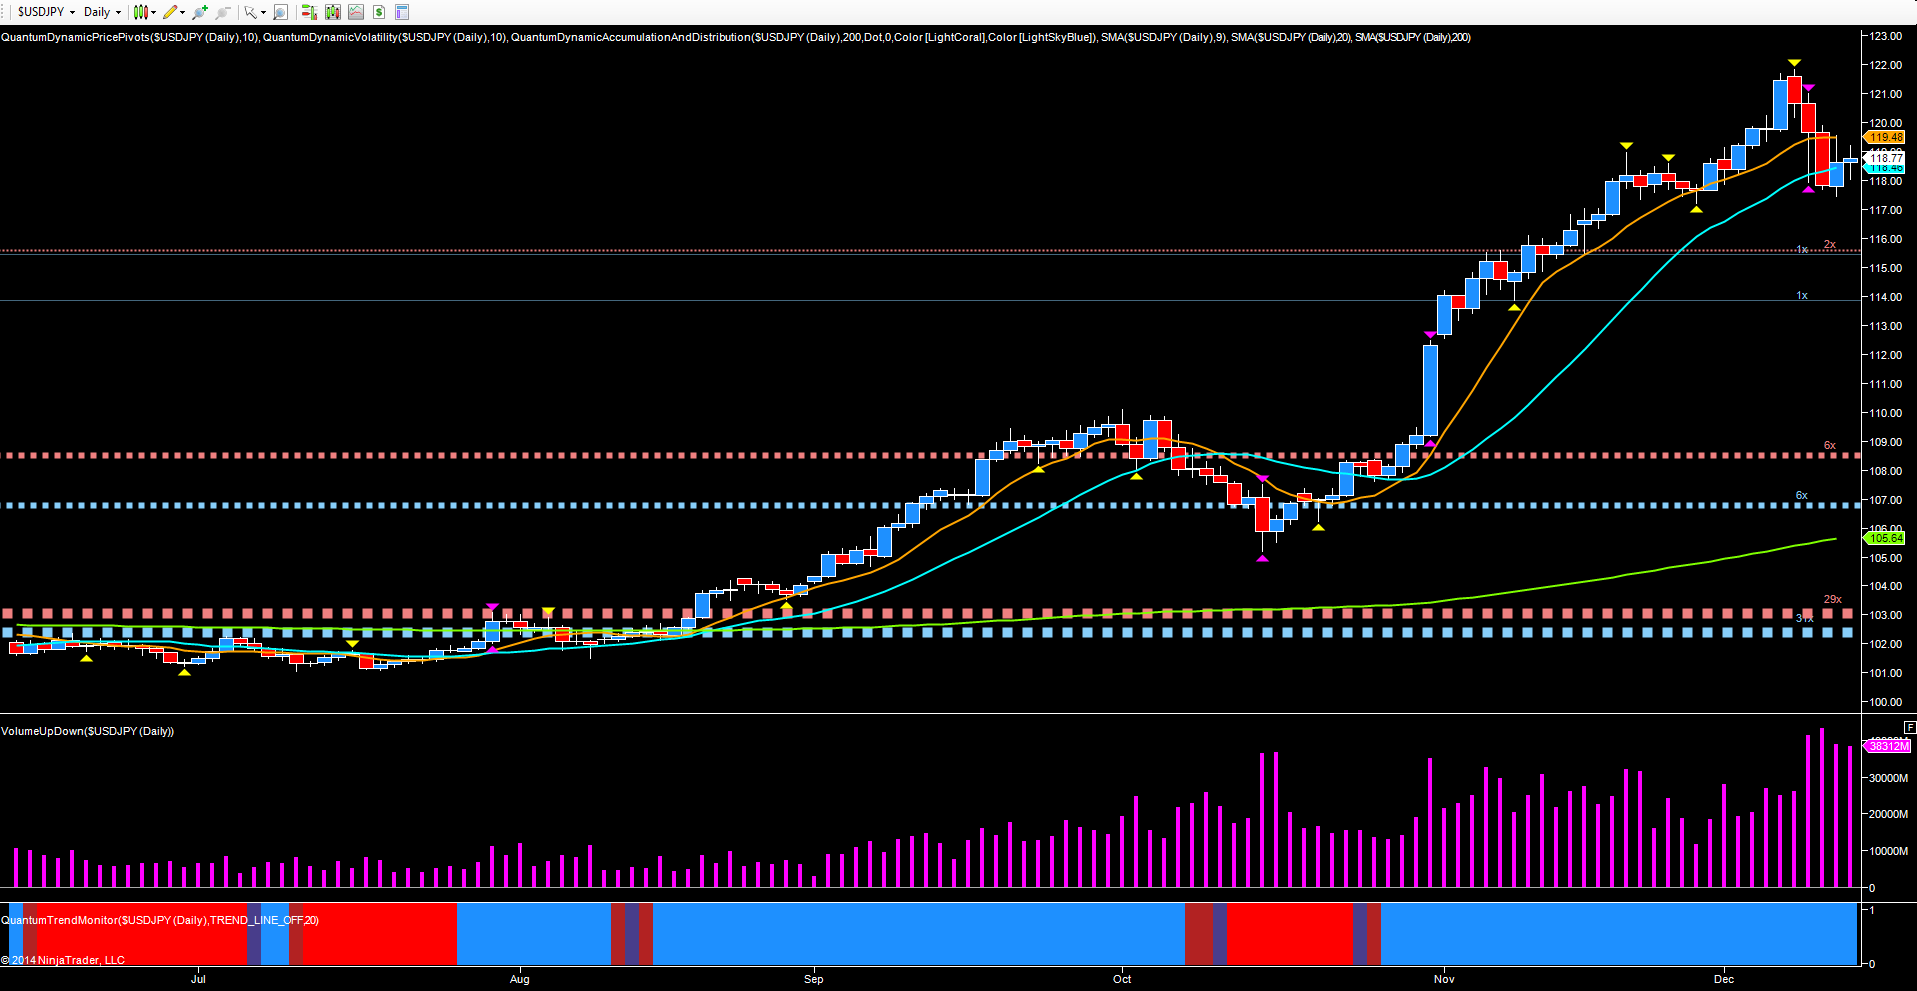
Stranger still has been the behaviour of the yen. Whilst the early part of the week was characterized by a flurry of yen buying as markets fell with a consequent flight to safety, on Friday, the yen actually sold off, against the USD/JPY, and most of the cross currency pairs. Curioser and curioser as Alice said to the White Rabbit! Indeed the volume on the daily chart for the USD/JPY clearly signals buying of the pair and support at this level, and certainly not the heavy selling we might expect.
Moving to the index charts themselves, and in particular the associated volumes, the yardstick here is the volume of last week when compared against the volumes of the reversal in September, and what is clear is that the volume on Friday was approximately half that of an equivalent candle. Volume on Friday for the NQ emini was 402K against an equivalent of between 600K and 700K and suggesting that this is simply another managed and coordinated reversal with oil as the media vehicle. Indeed Thursday’s price action was the pre-cursor to Friday, where the market was moved higher and fast on low volume before reversing equally quickly. A planned moved in preparation for Friday. In addition, and as I have said many times before, we have yet to see a selling climax either in the futures market or indeed the cash markets, and if and until we do, then this is once again a correction of the longer term trend higher.
And a further curiosity given the depths of these falls, bond yields on the 2 and 10 year notes have not fallen as dramatically as one might expect, in sharp contrast to the VIX which has reacted as expected.
So some interesting times as we move towards year end. Santa’s rally appears to have juddered to a halt in the snow, but for traders it’s time to awake and to separate fact from fiction with volume and related market activity revealing the true path.