
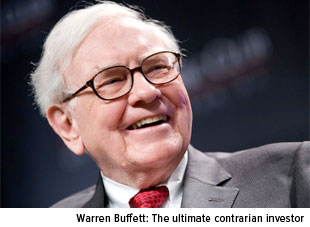
In an October 2008 op-ed in the New York Times, Warren Buffett famously advised: “Be fearful when others are greedy, and be greedy when others are fearful.”
Whereas most investors during that time of financial panic were dumping their freefalling U.S. equities, Buffett was snatching them up at such great volume that he imagined his personal, non-Berkshire Hathaway portfolio would soon be composed only of domestic stocks.
“I haven’t the faintest idea as to whether stocks will be higher or lower a month—or a year—from now,” he continued. “What is likely, however, is that the market will move higher, perhaps substantially so, well before either sentiment or the economy turns up.”
The same is true for oil prices. I can’t say when oil will begin to recover or by how much. What I can say is this: For far too many investors, by the time they gain back the confidence to put money into oil stocks again, the rally might have already taken off, making it challenging to capture the full benefit of the upswing.
Think of it this way. Every Black Friday, merchandise is discounted to such an extent that thousands of bargain shoppers are willing to camp overnight in parking lots to be the first inside. When the doors open, people literally get pushed, shoved, elbowed and trampled on.
But too often, the stock market works in a curiously opposite way. When certain stocks drop in price, investors scramble for the exit instead of picking up the bargains.
Oil Extremely Oversold
Oil tycoon T. Boone Pickens recently told Mad Money’s Jim Cramer that oil would return to $100 within 12 to 18 months. Again, there’s no guarantee that this will happen—and keep in mind that it’s in Pickens’ self-interest that oil reach these figures again—but if it does, the most opportune time to participate in the oil trade could be now when stocks are at a discount.
Pickens’ prediction aside, there are sound reasons to believe that oil prices will be normalizing sooner rather than later.
For one, oil prices are currently below many countries’ breakeven prices. This could finally encourage the Organization of the Petroleum Exporting Countries (OPEC) to cut production, so long as Saudi Arabia got assurances from fellow members that they would comply with the cuts. Where they are right now, prices simply aren’t sustainable. According to Business Insider, oil rigs in the Permian Basin have fallen by nine; those in Williston by seven; and those in Marcellus by one.
Brian Hicks, portfolio manager of our Global Resources Fund (PSPFX), believes that the bottom for oil prices might have already been reached.
“Aggressive capex cuts in the oil industry right now will lead to lower supply in 2015 and 2016, increasing demand and pushing up prices,” Brian says. “Plus, there might be a positive seasonal trading session over the next few weeks, with a possible laggard rebound in January.”
Although past performance is no guarantee of future results, the chart below, which takes into account 30, 15 and five years’ worth of seasonal data for oil prices, illustrates Brian’s point. In the 30-year range, a steady decline in prices began in October and bottomed in February. This was followed by a substantial rally that carried us through the first and second quarters of the year. It’s possible the same will happen again early next year. 
“The theme going into 2015 is mean reversion,” Brian said in a Frank Talk a couple of weeks ago. “Oil prices are below where they should be, and hopefully they’ll start gravitating back to the equilibrium price of between $80 and $85 a barrel.”
Bad News Is Good News
While we wait for oil to revert back to its mean, however, the world can enjoy and benefit from inexpensive gas. Call it the “oil peace dividend.” Here in the U.S., the current average for a gallon of gas is $2.45. Just one year ago, it was $3.21 per gallon, $0.76 higher. Over the course of a year, those extra cents add up.
But the U.S. isn’t the only country that benefits from affordable fuel.
In an article titled “The Saudi Stimulus,” Jon Markman writes that the global economy is looking to save hundreds of billions of dollars on an annual basis: According to EIA [U.S. Energy Information Administration] data, consumption of crude oil during the latest 12 months was 6.9 billion barrels. So the price drop from $107/barrel at the June 2014 high to $59 today represents a total presumptive savings of $332 billion per year.
In a time when China, the European Union and other major markets are trying to jumpstart their economies, a $330 billion tax break can only come as good news. It should help in stimulating spending and driving global economic growth.
The Weakening Russian Bear
It’s impossible not to discuss falling oil prices without also touching on Russia, half of whose budget depends on $100-per-barrel oil exports. In the past month alone, the federation’s currency has plunged more than 30 percent to 60 rubles to the dollar as Brent oil has slipped nearly 25 percent. 
President Vladimir Putin couldn’t have chosen a worse time to annex the Crimean peninsula because now the region must be subsidized with money Russia doesn’t really have at the moment. (That’s not to say, of course, that there was ever a good time to invade Ukraine, or that Putin could have predicted the dramatic decline in Brent oil prices.) But even before the ruble began to unravel, stocks in Russia’s MICEX Index had already taken a hit in July and fallen out of lockstep with other emerging markets. 
There’s no lack of commentators making comparisons between the Russian Federation’s current tailspin and the country’s 1998 debt crisis. But a more apt comparison might be the lead-up to the collapse of the Soviet Union in 1991, given the many uncanny parallels between then and now involving oil.
Yegor Gaidar, acting prime minister of Russia between 1991 and 1994, wrote in 2007: The timeline of the collapse of the Soviet Union can be traced to September 13, 1985… The Saudis stopped protecting oil prices, and Saudi Arabia quickly regained its share in the world market. During the next six months, oil production in Saudi Arabia increased fourfold, while oil prices collapsed by approximately the same amount in real terms.
As a result, the Soviet Union lost approximately $20 billion per year, money without which the country simply could not survive.
Today, Russia is similarly hemorrhaging capital as a result of international sanctions and crashing oil prices, prompted by both the American shale oil boom and OPEC’s inaction in stabilizing the commodity at last month’s meeting.
It’s unclear for how long Russia’s government can support its oil-dependent budget. During his press conference last Thursday, President Putin conceded that spending cuts were unavoidable, but that “under the most unfavorable external economic scenario, this situation may go on for about two years.”
Some readers might find that prognosis a little too optimistic. It could be that Russia is in for a much lengthier period of damage control.
USGI’s Emerging Europe Fund Resilient to Russia’s Woes
It states in our prospectus that “government policy is a precursor to change.” As such, we believe Russia poses too great of a geopolitical risk for our investors. Because of nimble active management, our Emerging Europe Fund (EUROX) now has minimal exposure to Russia, thereby avoiding losses as significant as the Market Vectors Russia ETF (NYSE:RSX). 
This decision has also enabled the fund to outperform its benchmark, the MSCI Emerging Markets Europe 10/40 Index, which still maintained a 46-percent weighting in Russia as of the end of November. The index has consequently fallen more than 30 percent year-to-date, compared to EUROX’s 22.5 percent.
Since trimming nearly all of our Russian holdings, Turkey has replaced the beleaguered federation as our largest weighting in EUROX. The Borsa Istanbul 100 Index is currently up 16 percent year-to-date.
As anyone who watches the news closely knows, the situation in Russia is evolving rapidly day-to-day. We will continue to monitor events that could trigger opportunities in the region. In the meantime, check out EUROX’s current regional breakdown.
I would like to conclude by wishing all of our loyal shareholders as well as Investor Alert and Frank Talk readers a Merry Christmas, Happy Hanukkah and Season’s Greetings!
Disclaimer: Please consider carefully a fund’s investment objectives, risks, charges and expenses. For this and other important information, obtain a fund prospectus by visiting www.usfunds.com or by calling 1-800-US-FUNDS (1-800-873-8637). Read it carefully before investing. Distributed by U.S. Global Brokerage, Inc.
For information regarding the investment objectives, strategies, liquidity, risks, expenses and fees of the Market Vectors Russia ETF, please refer to that fund's prospectus.
Total Annualized Returns as of 09/30/2014 One-Year Five-Year Ten-Year Gross Expense Ratio Expense Ratio After Waivers Emerging Europe Fund -14.44% -1.61% 3.21% 2.13% n/a Market Vectors Russia ETF (RSX) -18.53 -2.23 n/a 0.71% 0.63% MSCI EM Europe 10/40 Index -13.19 1.04% 7.01% n/a n/a
Expense ratios as stated in the most recent prospectus. Performance data quoted above is historical. Past performance is no guarantee of future results. Results reflect the reinvestment of dividends and other earnings. For a portion of periods, the fund had expense limitations, without which returns would have been lower. Current performance may be higher or lower than the performance data quoted. The principal value and investment return of an investment will fluctuate so that your shares, when redeemed, may be worth more or less than their original cost. Performance does not include the effect of any direct fees described in the fund’s prospectus (e.g., short-term trading fees of 0.05%) which, if applicable, would lower your total returns. Performance quoted for periods of one year or less is cumulative and not annualized. Obtain performance data current to the most recent month-end at www.usfunds.com or 1-800-US-FUNDS.
EUROX vs. Market Vectors Russia ETF (RSX)
Investment Objective: The Emerging Europe Fund is an actively managed fund that takes a non-diversified approach to the Eastern European market. The fund invests in companies located in the emerging markets of Eastern Europe.
The Market Vectors Russia ETF seeks to replicate as closely as possible, before fees and expenses, the price and yield performance of the Market Vectors Russia Index. The Index includes companies that are incorporated in Russia or that generate at least 50% of their revenues (or, where applicable, have at least 50% of their assets) in Russia.
Liquidity: The Emerging Europe Fund can be purchased or sold at a net asset value (NAV) determined at the end of each trading day.
RSX issues and redeems shares at NAV only in a large specified number of shares, each called a “Creation Unit,” or multiples thereof. A Creation Unit consists of 50,000 shares. Individual shares of RSX may only be purchased and sold in secondary market transactions through brokers. Shares of RSX are listed on NYSE Arca Inc. (“NYSE Arca”) and because shares trade at market prices rather than NAV, shares of RSX may trade at a price greater than or less than NAV.
Safety/Fluctuations of principal/return: Loss of money is a risk of investing in the Emerging Europe Fund, as well as the Market Vectors Russia ETF. Shares of both of these securities are subject to sudden fluctuations in value, and when sold, may be worth more or less than their original cost.
Tax features: The Emerging Europe Fund may make distributions that may be taxed as ordinary income or capital gains. Under current federal law, long-term capital gains for individual investors in the fund are taxed at a maximum rate of 15%.
RSX’s distributions are taxable and will generally be taxed as ordinary income or capital gains.
Past performance does not guarantee future results.
Foreign and emerging market investing involves special risks such as currency fluctuation and less public disclosure, as well as economic and political risk. Because the Global Resources Fund concentrates its investments in specific industries, the fund may be subject to greater risks and fluctuations than a portfolio representing a broader range of industries.
By investing in a specific geographic region, a regional fund’s returns and share price may be more volatile than those of a less concentrated portfolio. The Emerging Europe Fund invests more than 25% of its investments in companies principally engaged in the oil & gas or banking industries. The risk of concentrating investments in this group of industries will make the fund more susceptible to risk in these industries than funds which do not concentrate their investments in an industry and may make the fund’s performance more volatile.
The MICEX Index is the real-time cap-weighted Russian composite index. It comprises 30 most liquid stocks of Russian largest and most developed companies from 10 main economy sectors. The MICEX Index was launched on September 22, 1997, base value 100. The MICEX Index is calculated and disseminated by the MICEX Stock Exchange, the main Russian stock exchange.
The MSCI Emerging Markets Europe 10/40 Index (Net Total Return) is a free float-adjusted market capitalization index that is designed to measure equity performance in the emerging market countries of Europe (Czech Republic, Greece, Hungary, Poland, Russia, and Turkey). The index is calculated on a net return basis (i.e., reflects the minimum possible dividend reinvestment after deduction of the maximum rate withholding tax). The index is periodically rebalanced relative to the constituents' weights in the parent index.
The MSCI Emerging Markets Index is a free float-adjusted market capitalization index that is designed to measure equity market performance in the global emerging markets.
The Borsa Istanbul Banks Index (XBANK) is a capitalization-weighted free float adjusted Industry Group Index composed of National Market listed companies in the banking industry. All members of the index are also constituents of the XUMAL Sector Index.
The Market Vectors Russia Index is a modified market cap weighted index that tracks the performance of the largest and most liquid companies in Russia. Its unique pure-play approach expands local exposure to include offshore companies that generate at least 50% of their revenues in Russia.
The S&P 500 Stock Index is a widely recognized capitalization-weighted index of 500 common stock prices in U.S. companies.
Fund portfolios are actively managed, and holdings may change daily. Holdings are reported as of the most recent quarter-end. Holdings in the Global Resources Fund and Emerging Europe Fund as a percentage of net assets as of 9/30/2014: Berkshire Hathaway 0.00%, Cubist Pharma 0.00%, Market Vectors Russia ETF 0.00%, Merck & Co., Inc. 0.00%.
By clicking the link(s) above, you will be directed to a third-party website(s). U.S. Global Investors does not endorse all information supplied by this/these website(s) and is not responsible for its/their content. All opinions expressed and data provided are subject to change without notice. Some of these opinions may not be appropriate to every investor.
- English (UK)
- English (India)
- English (Canada)
- English (Australia)
- English (South Africa)
- English (Philippines)
- English (Nigeria)
- Deutsch
- Español (España)
- Español (México)
- Français
- Italiano
- Nederlands
- Português (Portugal)
- Polski
- Português (Brasil)
- Русский
- Türkçe
- العربية
- Ελληνικά
- Svenska
- Suomi
- עברית
- 日本語
- 한국어
- 简体中文
- 繁體中文
- Bahasa Indonesia
- Bahasa Melayu
- ไทย
- Tiếng Việt
- हिंदी
The $330 Billion Global Tax Break?
Published 12/22/2014, 03:32 PM
Updated 07/09/2023, 06:31 AM
The $330 Billion Global Tax Break?
Latest comments
Install Our App
Risk Disclosure: Trading in financial instruments and/or cryptocurrencies involves high risks including the risk of losing some, or all, of your investment amount, and may not be suitable for all investors. Prices of cryptocurrencies are extremely volatile and may be affected by external factors such as financial, regulatory or political events. Trading on margin increases the financial risks.
Before deciding to trade in financial instrument or cryptocurrencies you should be fully informed of the risks and costs associated with trading the financial markets, carefully consider your investment objectives, level of experience, and risk appetite, and seek professional advice where needed.
Fusion Media would like to remind you that the data contained in this website is not necessarily real-time nor accurate. The data and prices on the website are not necessarily provided by any market or exchange, but may be provided by market makers, and so prices may not be accurate and may differ from the actual price at any given market, meaning prices are indicative and not appropriate for trading purposes. Fusion Media and any provider of the data contained in this website will not accept liability for any loss or damage as a result of your trading, or your reliance on the information contained within this website.
It is prohibited to use, store, reproduce, display, modify, transmit or distribute the data contained in this website without the explicit prior written permission of Fusion Media and/or the data provider. All intellectual property rights are reserved by the providers and/or the exchange providing the data contained in this website.
Fusion Media may be compensated by the advertisers that appear on the website, based on your interaction with the advertisements or advertisers.
© 2007-2024 - Fusion Media Limited. All Rights Reserved.