Tesla Motors (NASDAQ:TSLA.O), Inc. reports preliminary financial results for the quarter ended December 31, 2014.
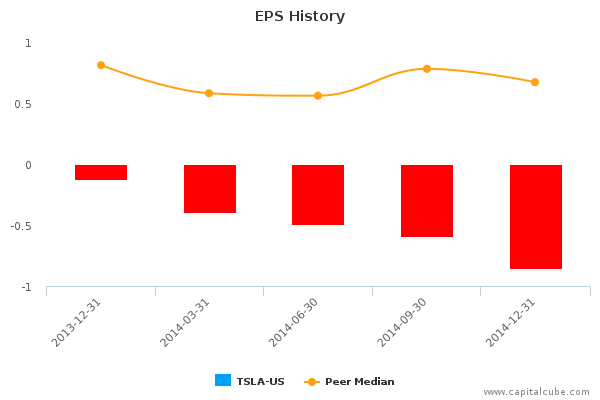
Electric car maker Tesla (NASDAQ:TSLA.O) turned in a fourth quarter adjust loss of $0.13/ share, substantially worse than expectations. The company’s misses included revenue, the number of cars it built, and the number of cars it delivered. Tesla attributed the under performance to bad weather, shipping problems, currency headwinds, and customer vacations that prevented planned deliveries.
In the fourth quarter, Tesla delivered 9,834 cars, which was a record, but was short of the target by 1,345 cars. Investors are nervous about the company’s future, as uncertainty about the impact of lower gasoline prices on customer demand, and the speed with which the company can ramp up production, call the stock’s lofty valuation into question.
This earnings release follows the earnings announcements from the following peers of Tesla Motors, Inc. – Ford Motor Company (NYSE:F), General Motors Company (NYSE:GM), Toyota Motor Corp Ltd Ord (NYSE:TM) Sponsored ADR, Honda Motor Company Ltd (NYSE:HMC), Sponsored ADR and Apple Inc (NASDAQ:AAPL).
Note that we added in Apple Inc to the peer group since Elon Musk has compared Tesla to Apple, and considering Apple's entry into the electric car market.
Highlights
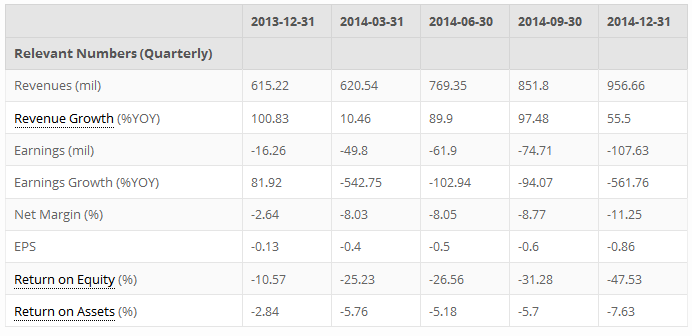
- Summary numbers: Revenues of USD 956.66 million, Net Earnings of USD -107.63 million, and Earnings per Share (EPS) of USD -0.86.
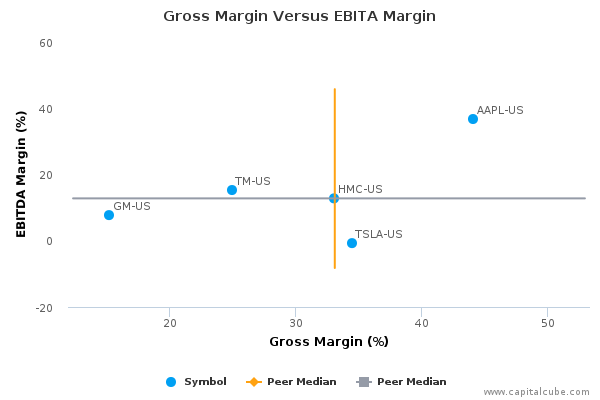
- Gross margins widened from 31.56% to 34.46% compared to the same quarter last year, operating (EBITDA) margins now -0.72% from 3.94%.
- Narrowing of operating margins contributed to decline in earnings.
- Earnings per Share (EPS) growth exceeded earnings growth
The table below shows the preliminary results and recent trends for key metrics such as revenues and net income growth:
Market Share Versus Profits
Companies sometimes focus on market share at the expense of profits or earnings growth.
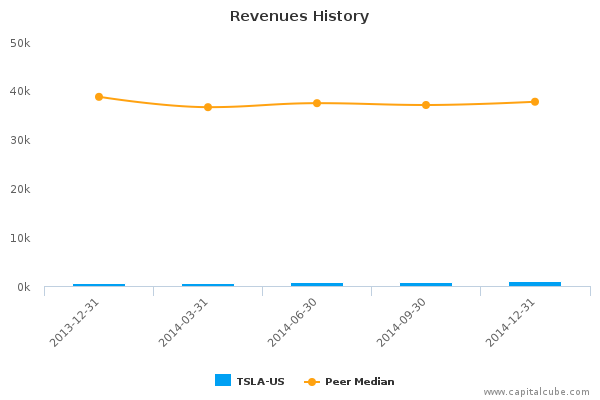
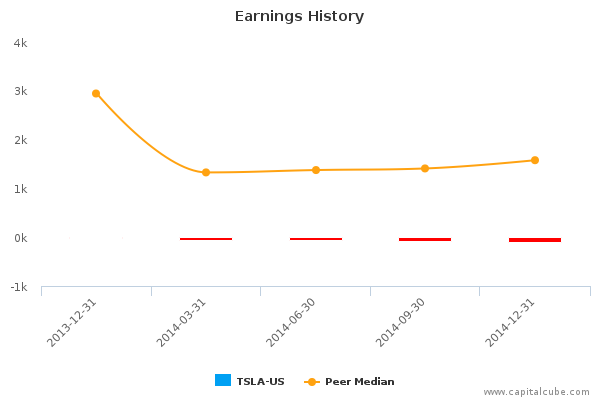
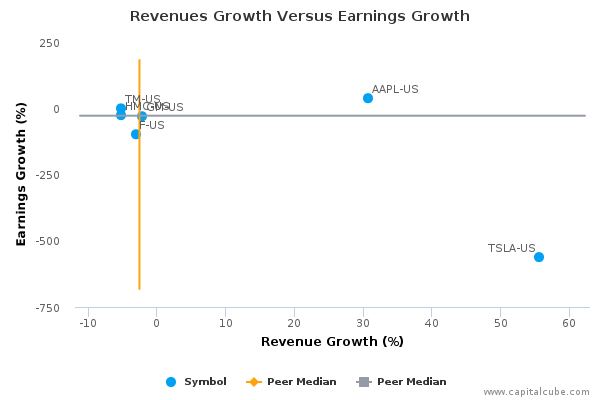
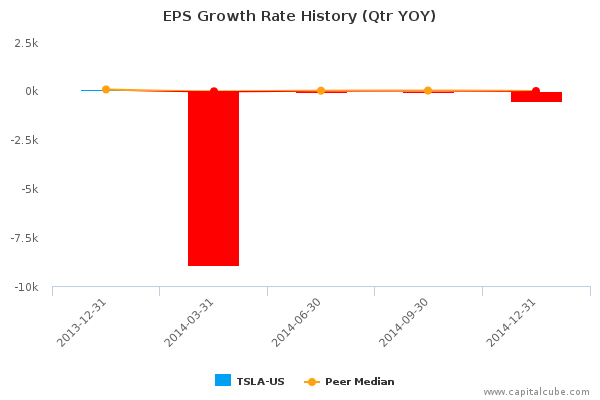
Compared to the same quarter last year, TSLA-US's change in revenue of 55.50% surpassed its change in earnings, which was -561.76%. This suggests perhaps that TSLA-US's focus is on market share at the expense of bottom-line earnings. However, this change in revenue is better than its peer average, pointing to perhaps some longer lasting success at wrestling market share from its competitors, and helping Capital Cube look past its weaker earnings performance this period. Also, for comparison purposes, revenues changed by 12.31% and earnings by -44.07% in the quarter ended September 30, 2014.
Earnings Growth Analysis
The company's earnings declined year-on-year largely because of the increases in operating costs. Its operating margins (EBITDA margins) went from 3.94% to -0.72%. This decline in earnings would have been worse except for the fact that the company showed improvement in gross margins, from 31.56% to 34.46%. For comparison, gross margins were 37.19% and EBITDA margins 3.03% in the immediate last quarter.
Gross Margin Trend
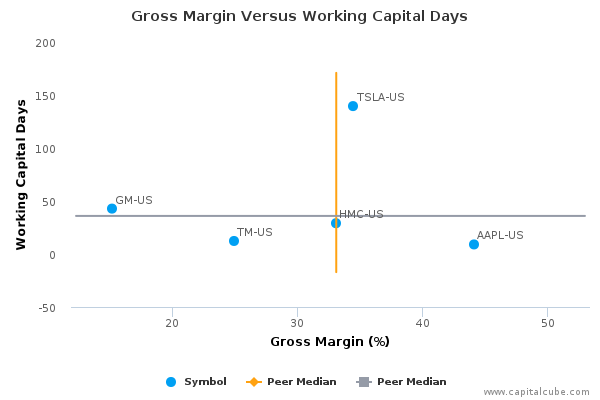
Companies sometimes sacrifice improvements in revenues and margins in order to extend friendlier terms to customers and vendors. Capital Cube probes for such activity by comparing the changes in gross margins with any changes in working capital. If the gross margins improved without a worsening of working capital, it is possible that the company's performance is a result of truly delivering in the marketplace and not simply an accounting prop-up using the balance sheet.
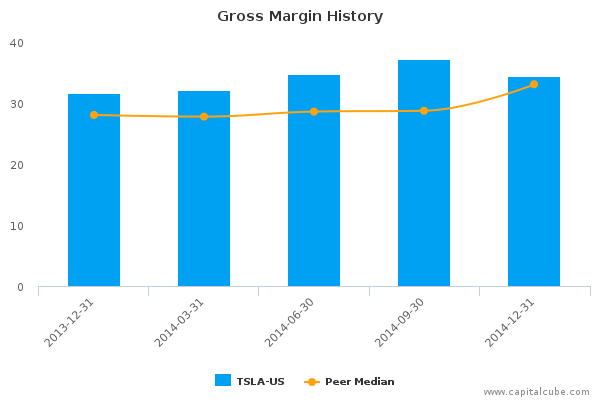
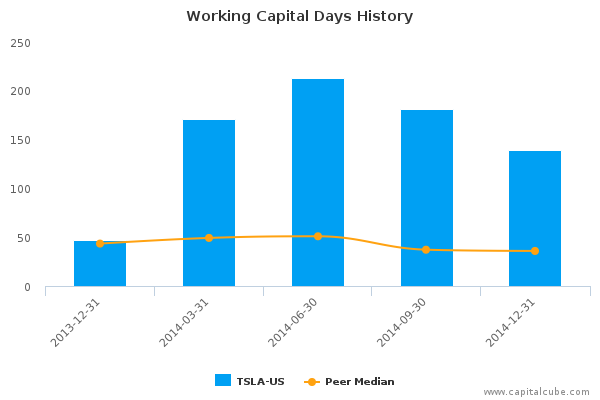
TSLA-US's improvement in gross margins have been accompanied by a deterioration in the management of working capital. This leads Capital Cube to conclude that the improvements in gross margins are likely accounting trade-offs with the balance sheet and not strictly from operating decisions. Its working capital days have risen to 139.52 days from last year's levels of 47.34 days.
Cash Versus Earnings – Sustainable Performance?
Margins
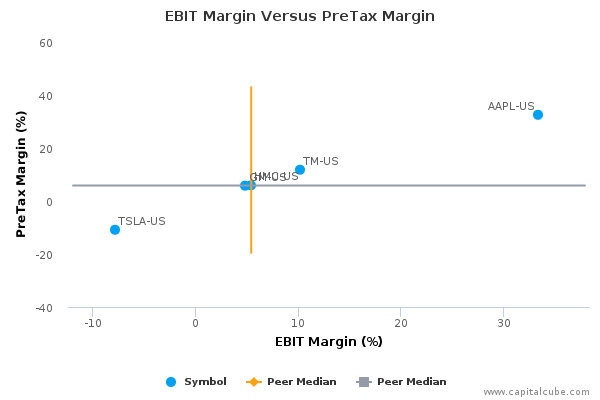
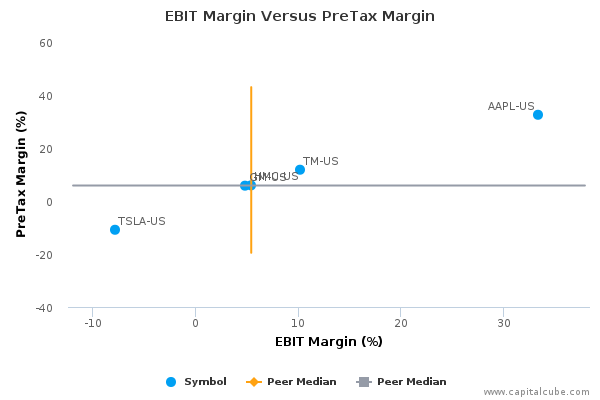
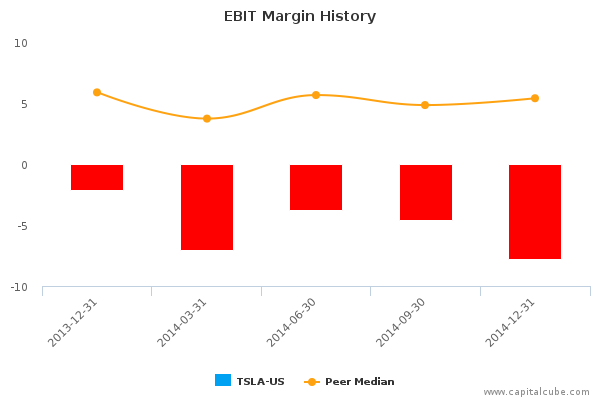
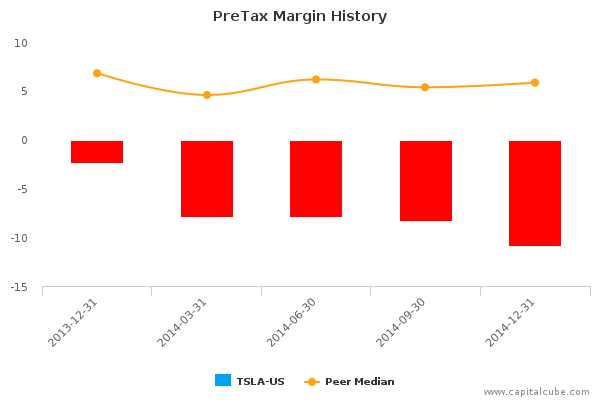
The company's decline in earnings has been influenced by the following factors: (1) Decline in operating margins (EBIT margins) from -2.17% to -7.82% and (2) one-time items that contributed to a decrease in pretax margins from -2.42% to -10.86%
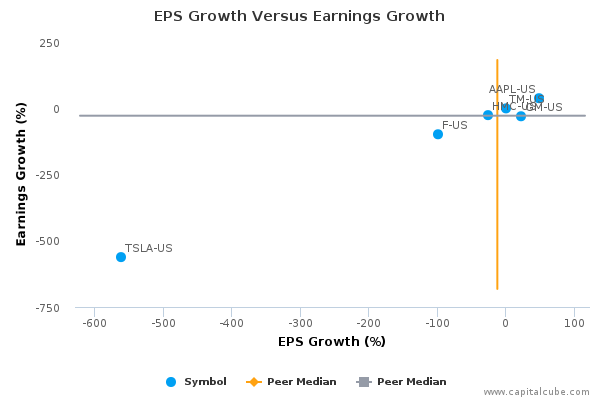
EPS Growth Versus Earnings Growth
TSLA-US's change in Earnings per Share (EPS) of -561.54% compared to the same quarter last year is better than its change in earnings of -561.76%. At the same time, this change in earnings is less than the peer average among the results announced by its peer group, suggesting that the company is losing ground in generating profits from its competitors.
Company Profile
Tesla Motors, Inc. designs, develops, manufactures and sells fully electric vehicles and advanced electric vehicle powertrain components. It provides services for the development of electric powertrain components and engages in the sale of electric powertrain components to other automotive manufacturers. Tesla Motors has manufactured its first electric vehicle, Tesla Roadster in 2008. The company was founded by Jeffrey B. Straubel, Elon R. Musk and Marc Tarpenning on July 1, 2003 and is headquartered in Palo Alto, CA.
CapitalCube does not own any shares in the stocks mentioned and focuses solely on providing unique fundamental research and analysis on approximately 50,000 stocks and ETFs globally. Try any of our analysis, screener or portfolio premium services free for 7 days. To get a quick preview of our services, check out our free quick summary analysis of TSLA-US.
