Key Points:
- Technical forces could explain the pair’s defiance of last session’s bias.
- Bullish channel remains intact and ABC wave is now forming.
- Parabolic SAR signalling the recent uptrend could remain in play.
In a rather surprising move, the Cable largely resisted the effects of last session’s stronger than forecasted US economic news which overwhelmed most pairs. In fact, the Cable actually went entirely contrary to the prevailing market trend and actually closed higher, even with the Bank of England releasing a rather gloomy Financial Stability Report alongside the US data. Consequently, it may be worthwhile looking for a technical explanation for why the pair seems so resistant to selling pressure all of a sudden.
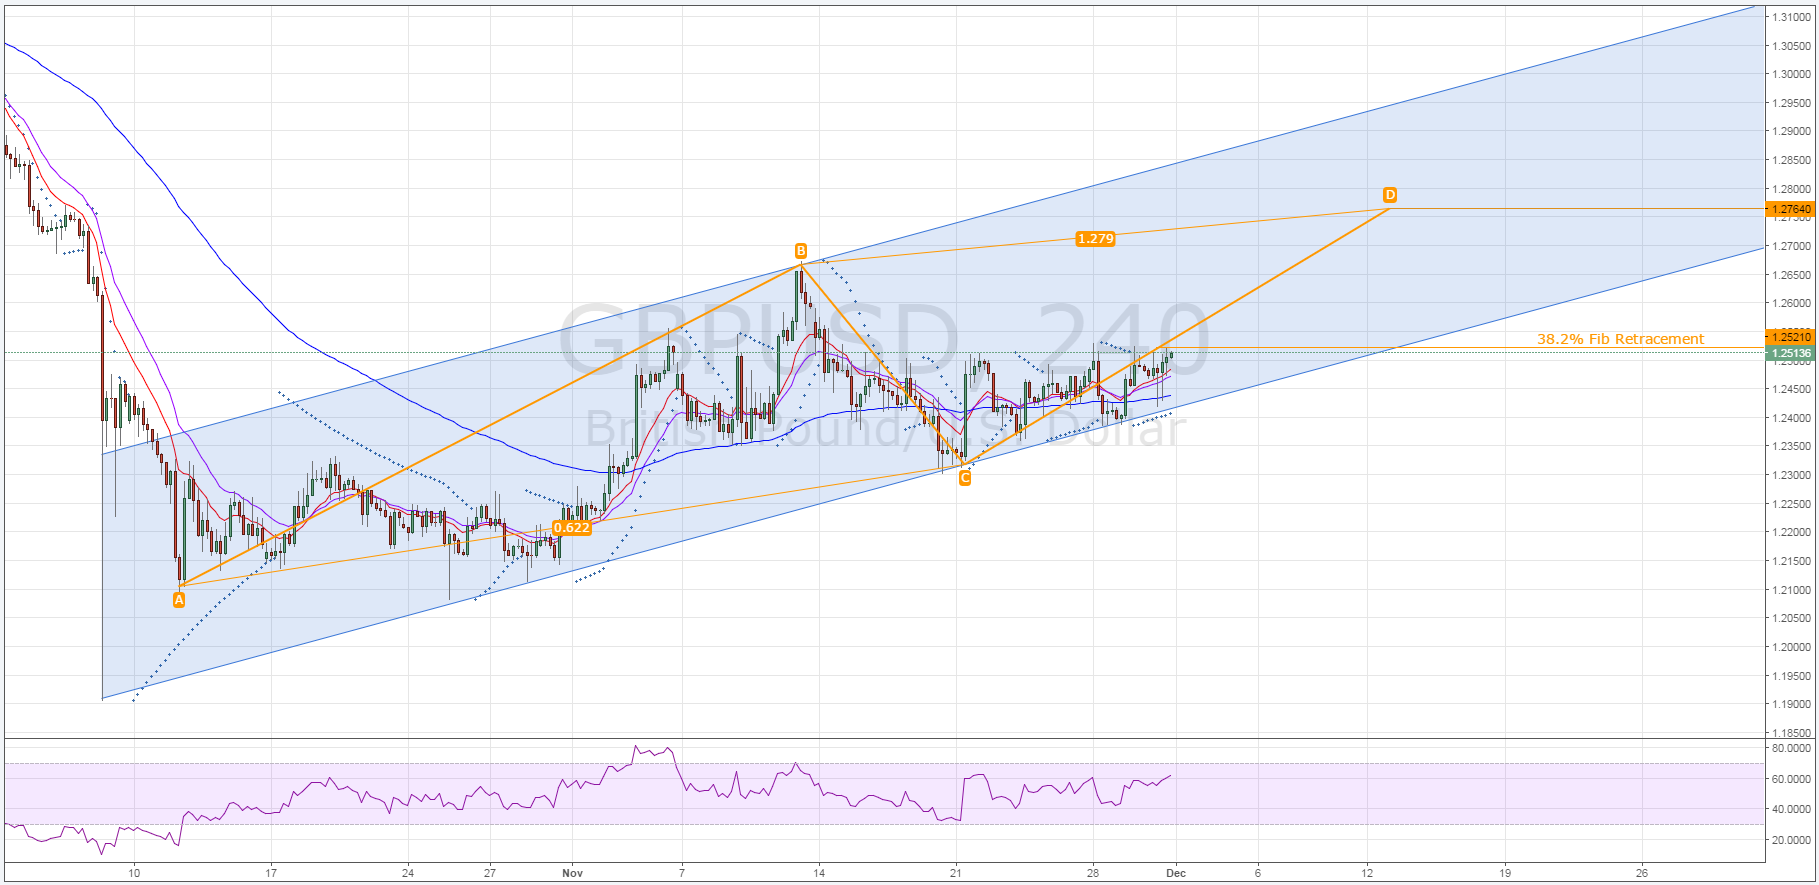
First things first, the presence of the pair’s bullish channel provides a good starting point to discuss why the GBPUSD is likely to remain in an uptrend in the near to medium-term. As depicted below, the downside constraint of the channel has been tested fairly rigorously but remains intact. As a result, as long as the Cable remains within relatively close proximity to the lower boundary, the bears are unlikely to be able to recruit in force and generate any significant selling pressure.

However, within the channel another pattern is taking shape which further suggests that the pair might continue ascending even after distancing itself from the downside constraint of the channel. Namely, an ABC wave is becoming apparent and, if the retracements typical of this pattern occur, we could see the Cable move back to around the 1.2764 mark by mid-December.
A move back to the central tendency of the channel is also supported by a number of other technical signals which shouldn’t be omitted from the analysis. Specifically, the EMA bias on the four hour chart is patently bullish and the daily chart’s EMA bias is beginning to come around as well. Similarly, the Parabolic SAR readings on the shorter timeframe charts are signalling that there is potential for continued gains moving forward and the daily chart is on the verge of switching its bias to reach this same conclusion.
Ultimately, one can’t rule out the effects of impending fundamental results as we move forward as, until recently at least, they have been a source of substantial volatility. However, given last session’s performance, there could be a larger scope to factor in the technical perspective in short-term forecasts, even for pairs that have been slammed by geopolitical and economic forces recently.
