In last week's technical update entitled A Sellable Rally, I stated:
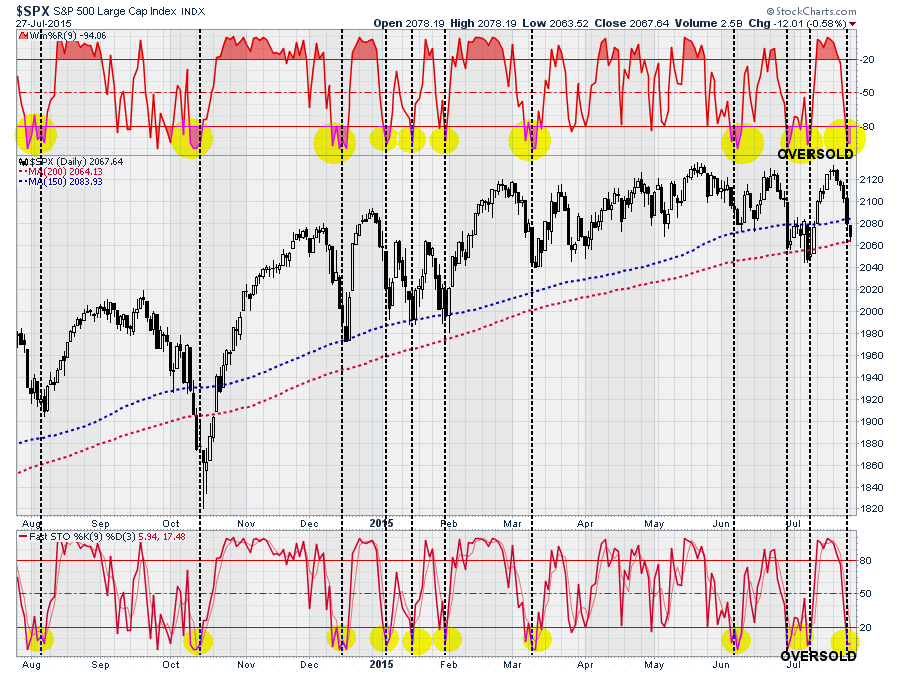
"As shown in the chart below, the recent market 'sell-off' exhausted the "sellers" in the market on a very short-term basis. This 'oversold' condition (yellow highlights) provides the catalyst necessary for a reflexive bounce in the market."
Any rally that occurs over the next few days from the current oversold condition should be used as a "sellable rally" to rebalance portfolios and related risk."
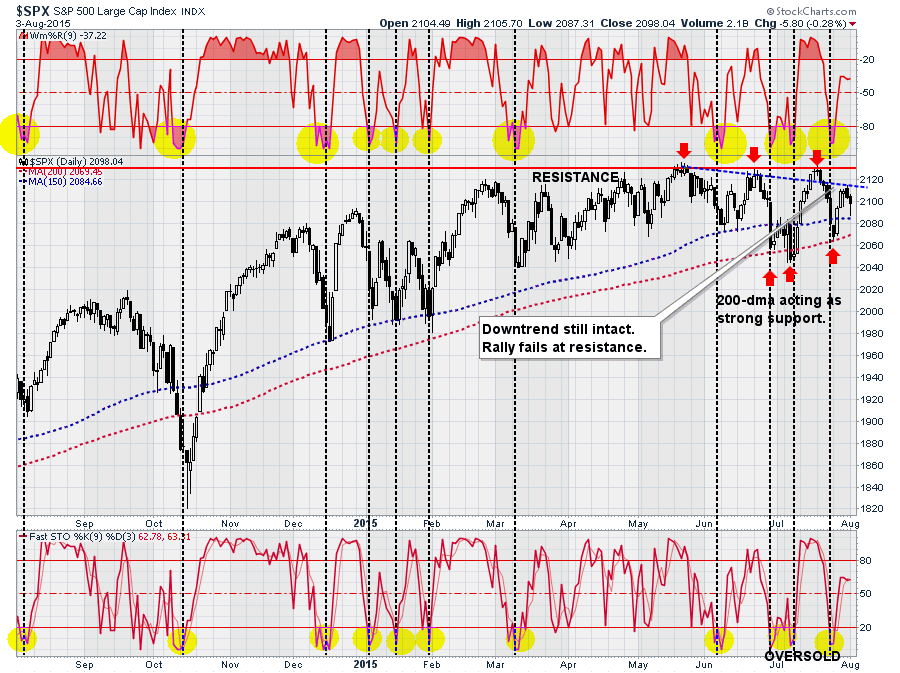
I have updated last week's chart, below, to show the "sellable rally" and a few other related points.
- While the market did rally over the last week as expected, it failed to rally above the current downtrend that has confined the market since mid-May.
- The failure of the market to rise back towards new-highs, given the "oversold" condition discussed last week, continues to confirm the underlying weakness in the market.
- While overhead resistance has kept the markets from rising in recent months, downside support at the 150 and 200-day moving averages has kept the "bullish trend" alive for now.
- Lastly, the oversold condition that existed last week has been primarily worked off. However, the market has not returned to an overbought condition that has previously marked the end of bull rallies. The market must close above 2180 by Friday's close to reverse the current weakness.
This short-term analysis suggests, especially when combined with the ongoing deterioration of internal measures, that rallies remain useful opportunities to rebalance portfolio risk as discussed last week.
That advice is particularly relevant given the historical tendencies of the month of August. As I discussed in last weekend's newsletter:
"[Stocktrader's Almanac stated] 'Additional technical concerns can be seen in our latest interpretation of the Three Peaks and a Domed House Top Pattern we have been tracking. If it plays out, my 'count' suggests further downside potential exists. While we are about halfway to the long averted 10% correction we are not expecting a bear market to ensue at this juncture. However, there is no rush to jump back into the equity long side at this time.
The first nine days of August are notoriously weak as are the last few days of the month as summer break winds to a close. Mid-month is stronger. After some choppy trading over the next few months and a strong potential for the first 10% correction in the S&P 500 in 4 years, we expect the market to rally to slightly higher highs by year end and perhaps into Q1 2016 after which we become more concerned for greater downside market action.'
The last sentence is something I discussed back in 2014. As I suggested then, the current bull market was likely to continue through 2015 based on statistical and historical analysis and trends. However, 2016 would likely not turn out well for those with a permanently bullish bias.
As I continue to reiterate, the market has NOT VIOLATED any of its current bullish trends - YET! However, the likelihood that it will has risen significantly. This is why I continue to reiterate a regular program of raising cash, reducing laggards, and trimming back on winners."
Bonds - Aren't They Supposed To Be Dead?
I had to laugh yesterday when a good friend of mine tweeted me the following:
This is something I have been adamant about since June of 2013. Despite the ongoing mainstream drivel that the "Great Bond Bull Market" is dead, the reality has been quite the opposite. As I stated over two years ago:
"Will the 'bond bull' market eventually come to an end? Yes, it will, eventually. However, the catalysts needed to create the type of economic growth required to drive interest rates substantially higher, as we saw previous to the 1980's, are simply not available currently. This will likely be the case for many years to come as the Fed, and the administration, come to the inevitable conclusion that we are now in a "liquidity trap" along with the bulk of developed countries. While there is certainly not a tremendous amount of downside left for interest rates to fall in the current environment - there is also not a tremendous amount of room for them to rise until they begin to negatively impact consumption, housing and investment. It is likely that we will remain trapped within the current trading range for quite a while longer as the economy continues to 'muddle' along."
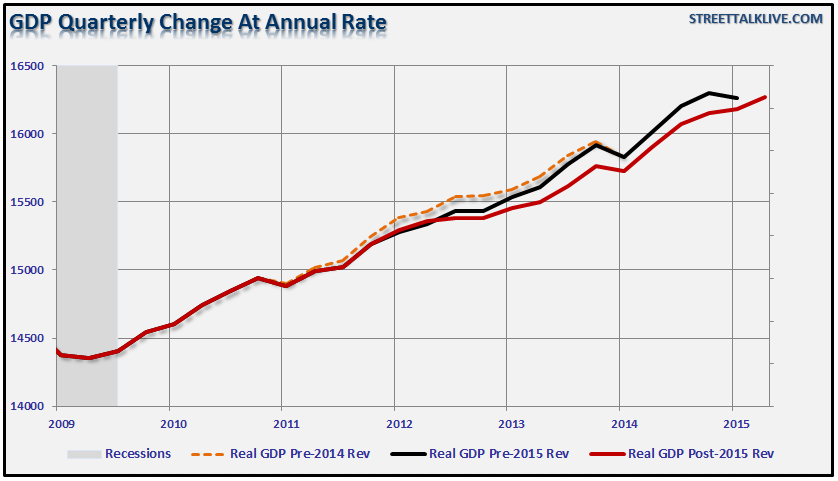
Of course, as we saw last week, and as I have continuously addressed over the last two years, economic growth was, and remains, substantially weaker than analysts/economists continue to estimate. Given that GDP has been overstated during each of the last three years, current estimates are also likely overstated given the weakness since in the bulk of manufacturing and spending data.
For a complete primer on the inter-linkage of bonds, the economy and your portfolio read The Interest Rate Conundrum.
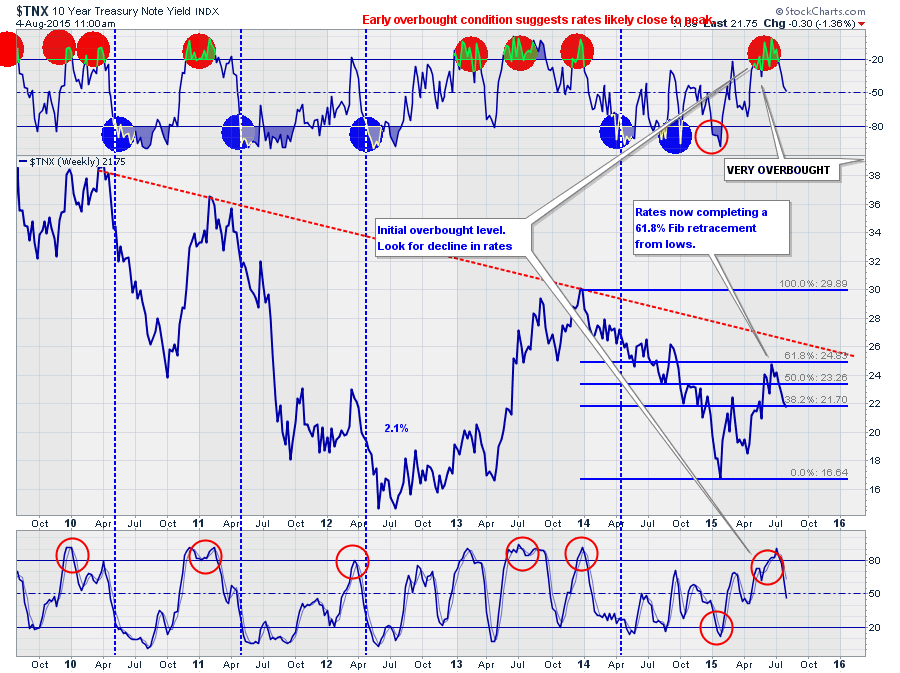
However, from a purely "technical" perspective, bonds remain encapsulated within a long-term downtrend and rallies to the downtrend line have been good "buying" opportunities for bonds. I regularly update the chart below in the weekly newsletter.
At the beginning of this year, interest rates fell sharply to 1.7% as concerns over extremely weak revenue growth and the Eurozone sent money out of foreign bonds into the "safety" of the US Treasury.
With interest rates very oversold at the time (bonds overbought), I suggested reducing bond exposure for the time being. The subsequent oversold rally in rates occurred as the ECB launched their own version of QE which shifted funds out of US bonds pushing rates back to their long-term downtrend. That rally led me to start suggesting adding bonds back into portfolios in early July. While rates have fallen some since then, to the benefit of bonds, there is still further potential to the downside currently. I still expect rates to revisit 2% before year end.
Bonds provide a significant benefit to portfolios of reducing volatility and adding to total return through the income stream generated. While owning bonds is not nearly as "sexy" as chasing the stock market, fixed income is a key component of a well-diversified long-term portfolio.
The one caveat is that bonds are no longer a "buy-and-hold" asset class as there is little room to the downside to create substantial capital appreciation. Therefore, like owning equities in a portfolio, fixed income will have to be treated more "tactically" in the future.
This is likely to be the case for potentially years to come as the structural shift in economic dynamics caused by high debt levels keeps inflationary pressures suppressed. If you don't think this is possible...just ask Japan.


