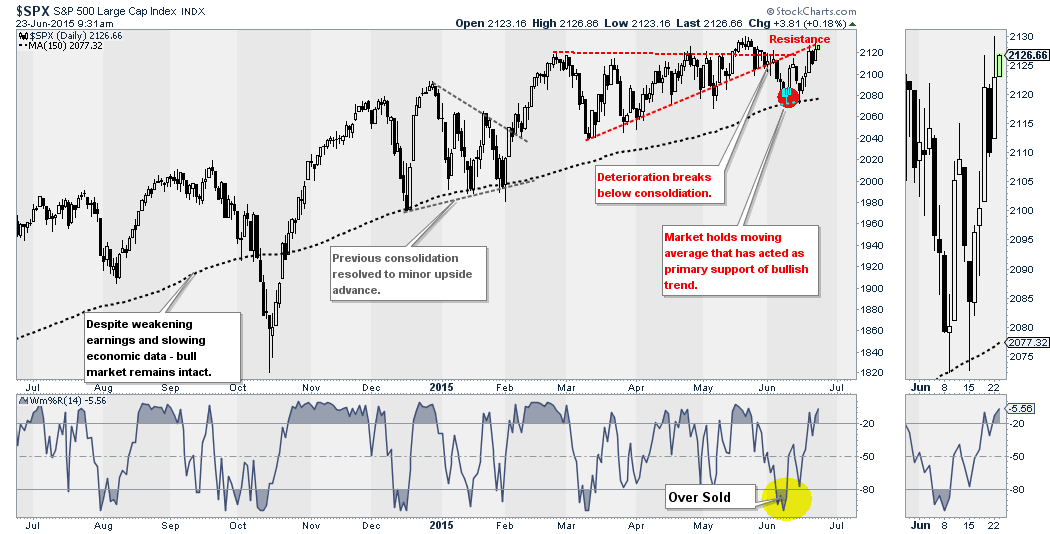
Over the last several months, I have been discussing the "consolidation" of the markets and the various support and resistance levels that have contained generally contained the markets since the beginning of this year. To wit:
"While the rally this week was nice, it failed to break back above resistance which it needs to do to reestablish the bullish trend. Currently, the markets have held the long-term bullish trend line that has remained intact since December of 2012 with two successful tests over the past month. That is bullish for now and indicates buyers are still in the market. However, there is a BATTLE being waged between the bulls and the bears as prices have continued to deteriorate from early-year highs. That battle should be resolved soon, and for now the bears have the advantage."
"Importantly, notice that the previous OVERSOLD condition in the lower panel is now back to OVERBOUGHT. This suggests that the current rally is likely near completion. This does not mean that the markets can't rally to new highs, they certainly could. However, the risk, for the moment is to the downside. As stated above, the BULLISH TREND remains intact which keeps portfolios allocated towards equities."
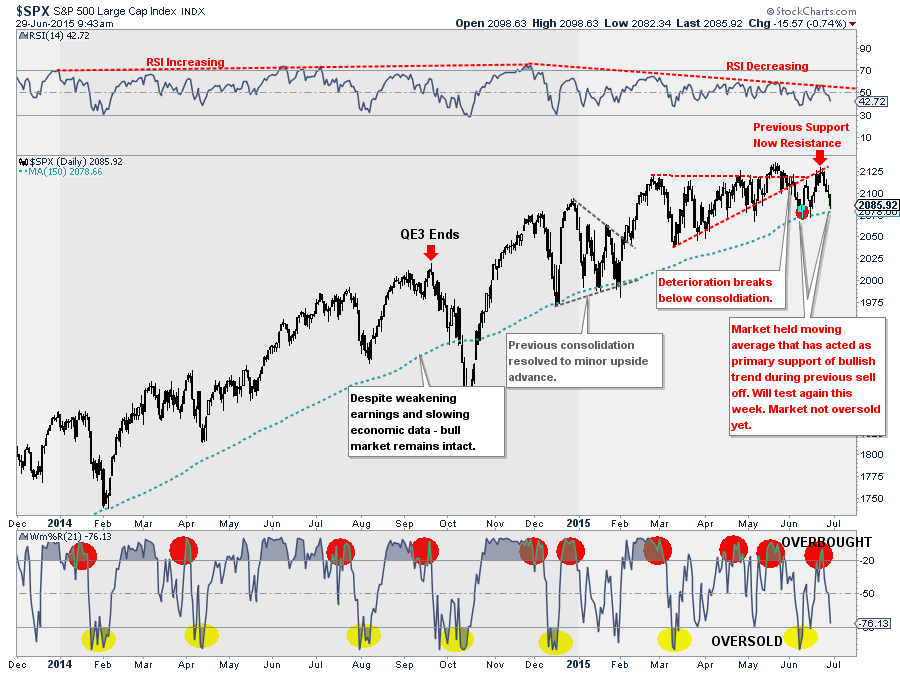
With that analysis, we can now update that chart to see how things have developed over the last week.
As you can see, the market is once again retesting that long-running 150-day moving average that has defined the "bullish trend" of the market since December of 2012. Of course, that month marked then Fed Chairman Ben Bernanke's announcement of the launch of QE3.
The Current Scorecard
This brings me to the ongoing conversation that I have been having with one of my favorite reporters over the last several weeks.
Q: Have we reached the trigger for a pullback here in the US? How concerned should investors be about the fallout from Greece?
The following answer refers to the updated chart above.
- The market held its primary bullish support trend line after breaking below the price consolidation that we have been discussing over the last several weeks. Bears score +1
- However, the market did hold its long-term uptrend at the 150-dma which has acted as important support for the market since late 2012. Bulls score +1
- The market then rallied and failed at the previous bullish consolidation support trend and turned lower last week. Bears score +1
- As shown in the lower part of the chart – the rally from the OVERSOLD condition at the 150-dma moved back into an OVER BOUGHT condition WITHOUT the market making a new high. Bears score +1
- Relative Strength (RSI) has been on the decline since last year as momentum has turned decidedly negative. This has been a non-confirmation of the bullish advance that historically has not ended positively. Bears score +1
At the open this morning, the market has once again test the 150-dma. If the market fails to hold that level by the end of the day, it is quite possible, given that the market is not OVERSOLD as of yet, that there could be further deterioration this week.
HOWEVER, as I have discussed many times in the past, for INVESTORS it is really only important where the markets close at the END OF THE WEEK. This is because for longer term investors it is the overall TREND of the market that we are ultimately concerned with.
Despite short-term volatility, which can be quite unnerving at times, portfolios must be allocated towards equity risk exposure as long as the overall market is still trending positively. When that positively biased trend changes to the negative, it is then that investors will want to become much more conservatively allocated. This is NOT MARKET TIMING. This is portfolio RISK MANAGEMENT. There is a massive difference between the two.
Therefore, even if the market breaks below 2080 today, as long as it closes above that level by the end of the week, then nothing has changed. A close BELOW that level will suggest that we are beginning a more significant correction toward the January lows of 2000.
Q. According to the "score card," the bears are winning. So, shouldn't investors be doing something now?
BEARS 4, BULLS 1
If this were a soccer game, we could most likely predict the winner. So, technically, yes, I could make the case for gathering up your belongings and leaving the stadium early to beat the traffic.
However, if you do leave the game early, i.e. SELL, you might be disappointed to find out on your ride home that the Bulls rallied back and scored 5 points in the last few minutes. It is not likely, but it is possible.
This is why we wait for the evidence to be presented before acting. The job of any investor is to make investment into one or more assets, and then manage the "risk" of owning that asset to create either:
- a "positive outcome" by garnering a "realized gain," or;
- to minimize the impact of a "negative outcome" by limiting "realized losses."
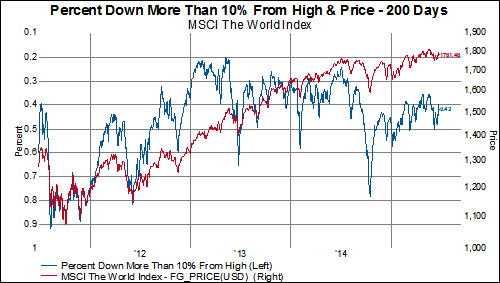
Currently, the technical deterioration in momentum and relative strength are suggesting that the market dynamics are far weaker than what the current price of the index suggests. As noted by GaveKal Research today:
"A correction is generally defined as any stock that is at least 10% off a recent high. If we look at a price performance over the past 200-days, 42% of all the stocks in the MSCI World Index (ARCA:EEM) are in a correction. Higher than you might have thought, right?"
There is sufficient cause for concern currently as the underlying weakness in the overall market is becoming much more pervasive. However, "guessing" at the outcome may leave you wishing you had stayed to see the "end of the game."
Is Greece The Thing?
Whether, or not, a Greek exit from the Eurozone or a potential debt default is "the thing" that sparks the next major correction in the markets is unknown. Historically, such a widely "known" event is generally already factored into the markets and has much less of an impact when that event eventually comes to fruition. As Art Cashin suggested Monday morning:
"I think China may be more important than Greece. Stick with the drill – stay wary, alert and very, very nimble."
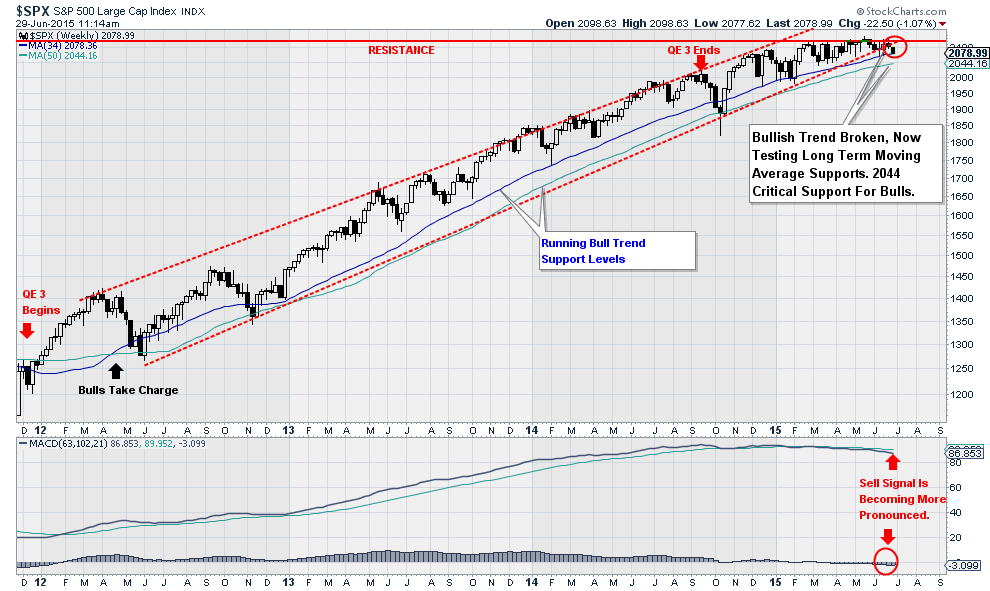
That is exactly the right advice for both traders and longer term investors. For longer term investors, I have always suggested using weekly and monthly charts to more clearly define the current trend of the market. However, this also means these charts are only updated at the end of each week or month, so what happens TODAY is far less important that where the market closes at the end of the relevant period. The final chart below is the weekly chart of the market.
There are several important points in the chart above. First, since the implementation of QE3 the bulls have clearly been in charge maintaining the bullish trend line since the June, 2012 lows. Secondly, there have been numerous sell-offs along the way, none of which have resulted in the need to grossly reduce equity exposure from fully allocated levels as of yet. "Yet" being the "key word."
Finally, the bullish moving averages, which have acted as primary support along this entire advance currently remain intact. This suggests that currently, outside of normal portfolio management processes, portfolios should be maintained near target equity allocation levels.
However, it is worth noting that the longer term MACD sell signal is becoming more pronounced which suggests that the "bull case" is weakening markedly. Where this chart finishes the week will provide a clearer picture of whether it is time to "leave the stadium" or "hang around for a terrific comeback."
One thing is for sure...things are about to become much more interesting.


