Get 40% Off
🚨 Volatile Markets? Find Hidden Gems for Serious OutperformanceFind Stocks Now

Bull Flag Now Setting Up In Gold

Published 09/26/2016, 05:35 AM
Updated 07/09/2023, 06:31 AM

Gold’s (XAU/USD) behavior over the past seven months continues to point to an eventual rise to higher prices.

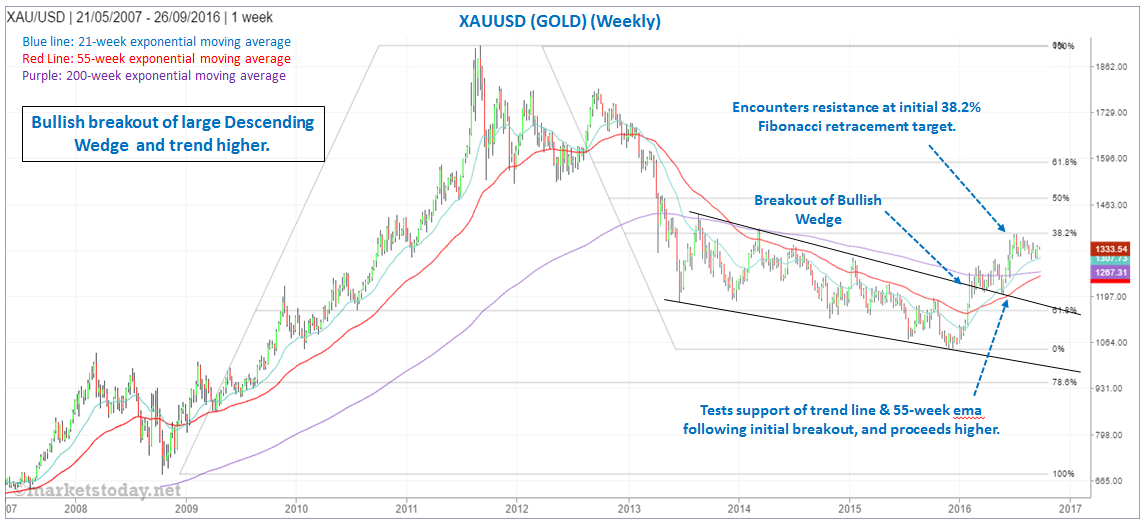
The precious metal broke out of a large bullish descending wedge pattern in February and has trended higher since. Resistance was most recently seen at 1,375.15 in early-July, thereby completing a 38.2% Fibonacci retracement (1,380.56)of the full decline off the 1,920.94 September 2011 high.

Subsequently, we entered a retracement and consolidation phase with gold forming a potential bullish flag trend continuation pattern. During the pull-back support has been seen at the 21-week exponential moving average over several weeks and has held. The low of the retracement is at 1,302.61.
XAU/USD Weekly 2008-2016

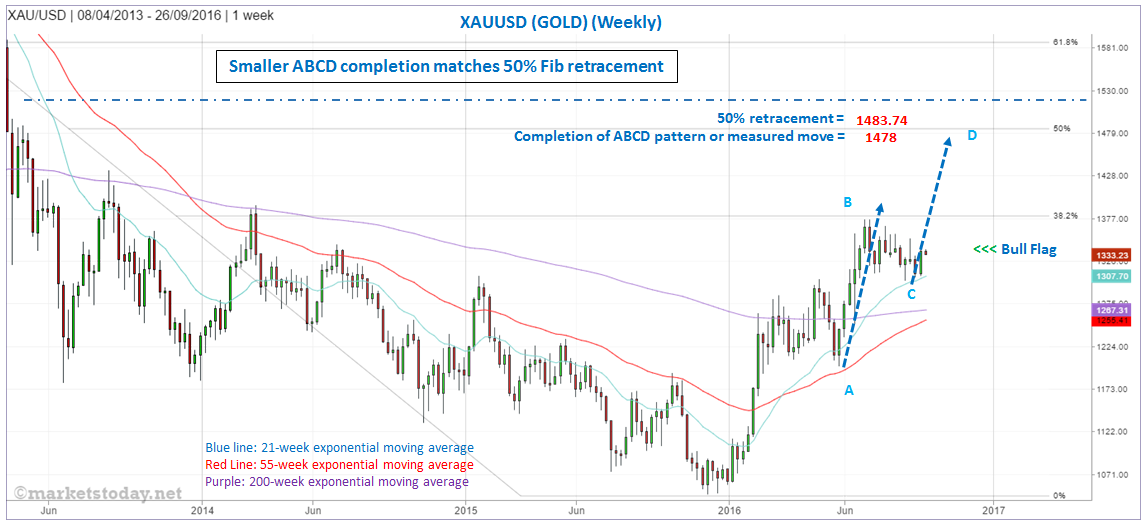
A bullish breakout of the flag would be indicated on a decisive rally above 1,352.61, while a drop below 1,302.61, indicates the flag is not yet complete. Lower prices would indicate that the pattern could be expanding or is evolving into a different pattern. A drop below the recent low could easily lead to the 200-week ema, now at 1,267, or the 55-week ema at 1,255.
XAU/USD Weekly

If a bullish breakout occurs the 50% retracement price zone around 1,483.74 looks to have a good chance of eventually being reached especially since the 38.2% target was almost an exact match with the most recent peak, even though it’s derived from a multi-year time frame.The potential significance of the 50% target area is enhanced by the fact that the more recent ABCD pattern completion or measured move is close by at 1,478, as can be seen in the chart above.

3rd party Ad. Not an offer or recommendation by Investing.com. See disclosure here or remove ads .

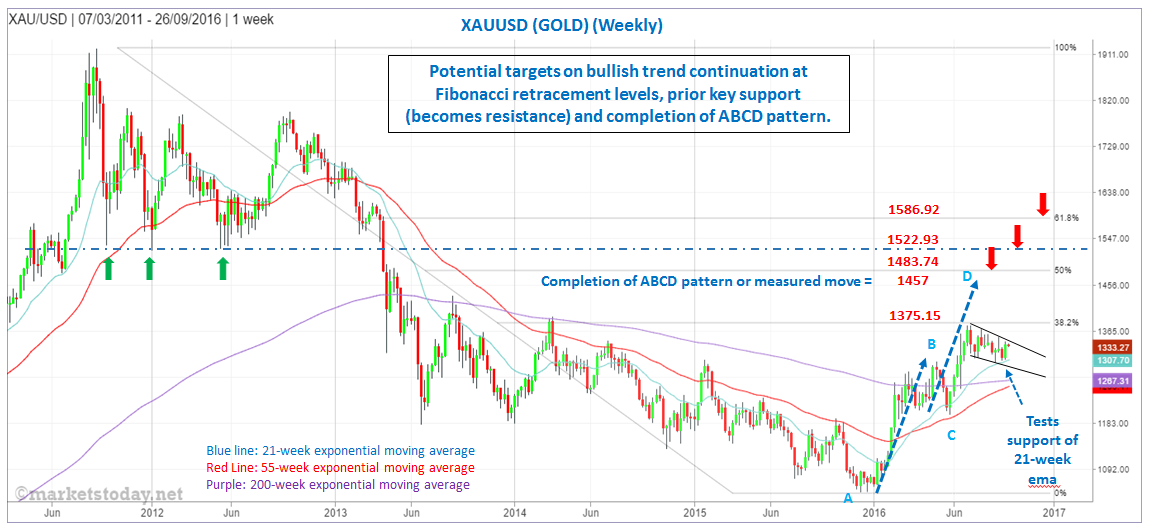
Other potential target levels are indicated in the chart below.
XAU/USD Weekly 2011-2016

Latest comments

Risk Disclosure: Trading in financial instruments and/or cryptocurrencies involves high risks including the risk of losing some, or all, of your investment amount, and may not be suitable for all investors. Prices of cryptocurrencies are extremely volatile and may be affected by external factors such as financial, regulatory or political events. Trading on margin increases the financial risks.
Before deciding to trade in financial instrument or cryptocurrencies you should be fully informed of the risks and costs associated with trading the financial markets, carefully consider your investment objectives, level of experience, and risk appetite, and seek professional advice where needed.
Fusion Media would like to remind you that the data contained in this website is not necessarily real-time nor accurate. The data and prices on the website are not necessarily provided by any market or exchange, but may be provided by market makers, and so prices may not be accurate and may differ from the actual price at any given market, meaning prices are indicative and not appropriate for trading purposes. Fusion Media and any provider of the data contained in this website will not accept liability for any loss or damage as a result of your trading, or your reliance on the information contained within this website.
It is prohibited to use, store, reproduce, display, modify, transmit or distribute the data contained in this website without the explicit prior written permission of Fusion Media and/or the data provider. All intellectual property rights are reserved by the providers and/or the exchange providing the data contained in this website.
Fusion Media may be compensated by the advertisers that appear on the website, based on your interaction with the advertisements or advertisers.
© 2007-2024 - Fusion Media Limited. All Rights Reserved.