Get 40% Off
🚨 Volatile Markets? Find Hidden Gems for Serious OutperformanceFind Stocks Now

Platinum Falls Behind Gold

Published 06/14/2016, 09:34 AM
Updated 12/18/2019, 06:45 AM

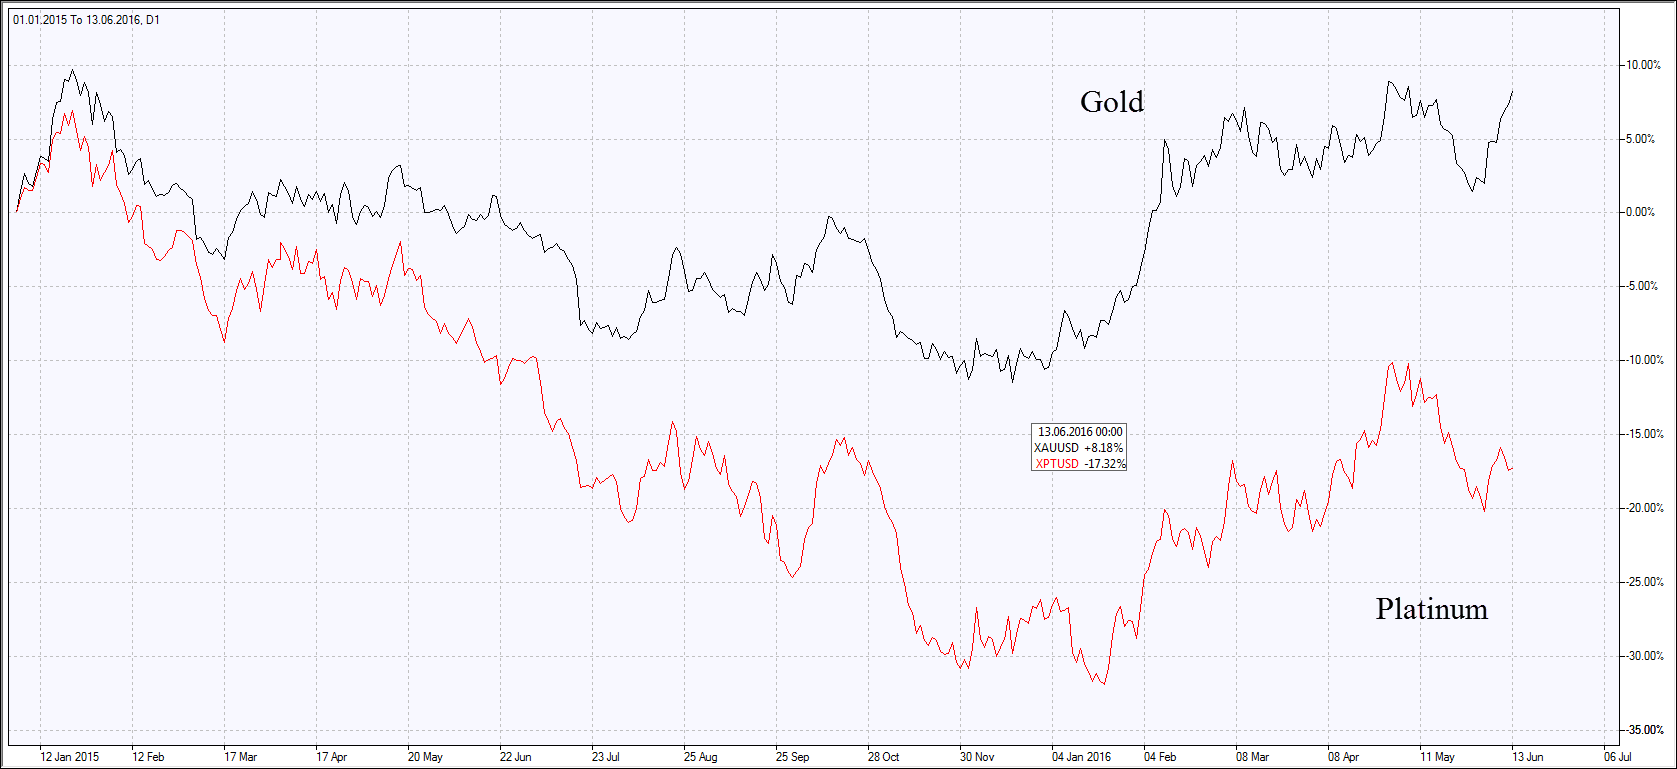
Gold and platinum price ratio has reached the level of 1,293 and has come close to the historical high of 1,344 set in January 2016. The gold has advanced 8% while platinum added 17% since the start of 2015. In general, higher demand for precious metals is fueled by Brexit concerns which referendum on the matter being scheduled on June 23. Another factor is delay with Fed rate hikes. Will platinum advance?

The chances for the Fed rate hike on June 15 are just 3% and for July meeting are below 20%. Meanwhile, the US 10-year yields hit their low since end of 2012 at 1.6% a year which is close to the US inflation that was 1.1% year on year in April. This makes the precious metals more appealing for investment. Holdings in the largest gold bullion ETF SPDR Gold Shares (NYSE:GLD) reached the highest since October 2013 of 893.92 tonnes on Friday. The US May inflation data will come out on June 16. This year the global platinum deficit of 195 thousand ounces is expected compared to its surplus of 54.4 thousand ounces in 2015.
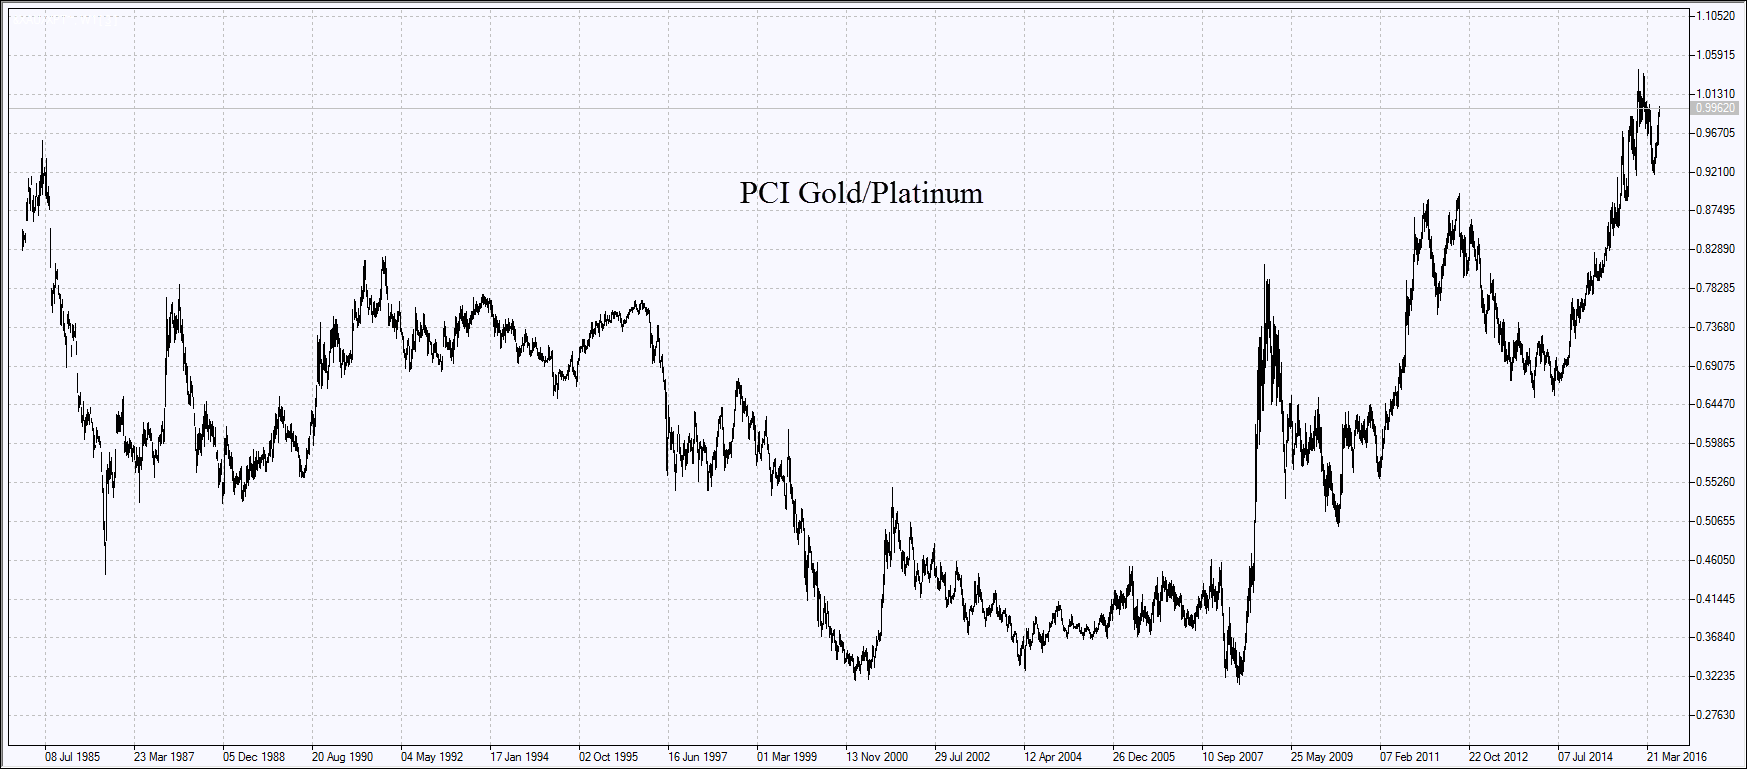
PCI Gold/Platinum Chart

Gold Platinum Chart

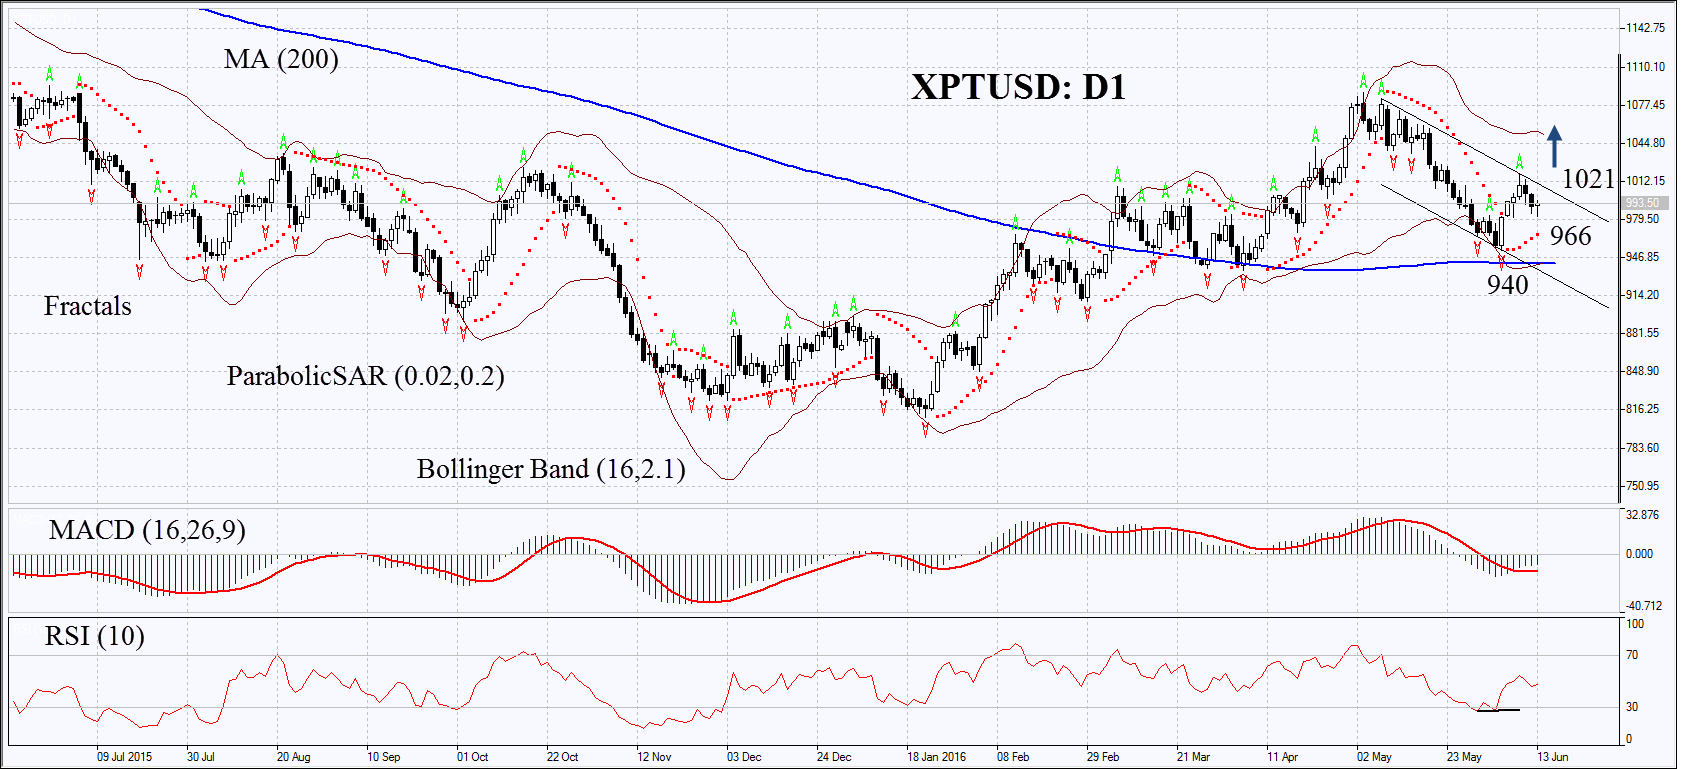
XPT/USD Daily Chart

On the daily chart XPTUSD: D1 has approached the resistance of the downtrend. Previously it failed to break down through its 200-day moving average and started rising. The MACD and Parabolic indicators give signals to buy. RSI is neutral and below 50. The Bollinger bands® have widened which means higher volatility. The bullish momentum may develop in case the platinum surpasses the last fractal high and the resistance of the descending channel at 1021. This level may serve the point of entry. The initial stop-loss may be placed below the support of the downtrend, the Bollinger band, Parabolic signal and the 200-day MA 940. Having opened the pending order we shall move the stop to the next fractal low following the Parabolic and Bollinger signals. Thus, we are changing the probable profit/loss ratio to the breakeven point. The most risk-averse traders may switch to the 4-hour chart after the trade and place there a stop-loss moving it in the direction of the trade. If the price meets the stop-loss level at 940 or 966 without reaching the order at 1021, we recommend cancelling the position: the market sustains internal changes which were not taken into account.

3rd party Ad. Not an offer or recommendation by Investing.com. See disclosure here or remove ads .

Position Buy Buy stop above 1021 Stop loss below 940 or 966

Latest comments

I'm also wondering if anyone tried calling the GLD hotline at (866) 320 4053 in search of numerical details on GLD's insurance. The prospectus vaguely states "The Custodian maintains insurance with regard to its business on such terms and conditions as it considers appropriate which does not cover the full amount of gold held in custody." When I asked about how much of the gold was insured, the representative proceeded to act as if he didn't know and said they were just the "marketing agent" fvoid(0);or GLD. What kind of marketing agent would not know such basic information about a product they are marketing? It seems like they are deliberately hiding information from investors.
"ETF SPDR Gold Shares (NYSE:GLD) ... 893.92 tonnes". . How reliable are GLD's holding reports? GLD does not give retail investors the right to redeem for any of its mystery physical gold holdings. This fact alone ensures the GLD shares to be nothing more than paper at the end of the day. GLD also has a glaring audit loophole in their prospectus that states they have no right to audit subcustodial gold holdings. To this day, I have not heard of a single good reason for the existence of this backdoor to the fund. . . I also remember there was a highly publicized visit by CNBC's Bob Pisani to GLD's gold vault. This visit was organized by GLD's management to prove the existence of GLD's gold but the gold bar held up by Mr. Pisani had the serial number ZJ6752 which did not appear on the most recent bar list at that time. It was later discovered that this "GLD" bar was actually owned by ETF Securities.
Risk Disclosure: Trading in financial instruments and/or cryptocurrencies involves high risks including the risk of losing some, or all, of your investment amount, and may not be suitable for all investors. Prices of cryptocurrencies are extremely volatile and may be affected by external factors such as financial, regulatory or political events. Trading on margin increases the financial risks.
Before deciding to trade in financial instrument or cryptocurrencies you should be fully informed of the risks and costs associated with trading the financial markets, carefully consider your investment objectives, level of experience, and risk appetite, and seek professional advice where needed.
Fusion Media would like to remind you that the data contained in this website is not necessarily real-time nor accurate. The data and prices on the website are not necessarily provided by any market or exchange, but may be provided by market makers, and so prices may not be accurate and may differ from the actual price at any given market, meaning prices are indicative and not appropriate for trading purposes. Fusion Media and any provider of the data contained in this website will not accept liability for any loss or damage as a result of your trading, or your reliance on the information contained within this website.
It is prohibited to use, store, reproduce, display, modify, transmit or distribute the data contained in this website without the explicit prior written permission of Fusion Media and/or the data provider. All intellectual property rights are reserved by the providers and/or the exchange providing the data contained in this website.
Fusion Media may be compensated by the advertisers that appear on the website, based on your interaction with the advertisements or advertisers.
© 2007-2024 - Fusion Media Limited. All Rights Reserved.