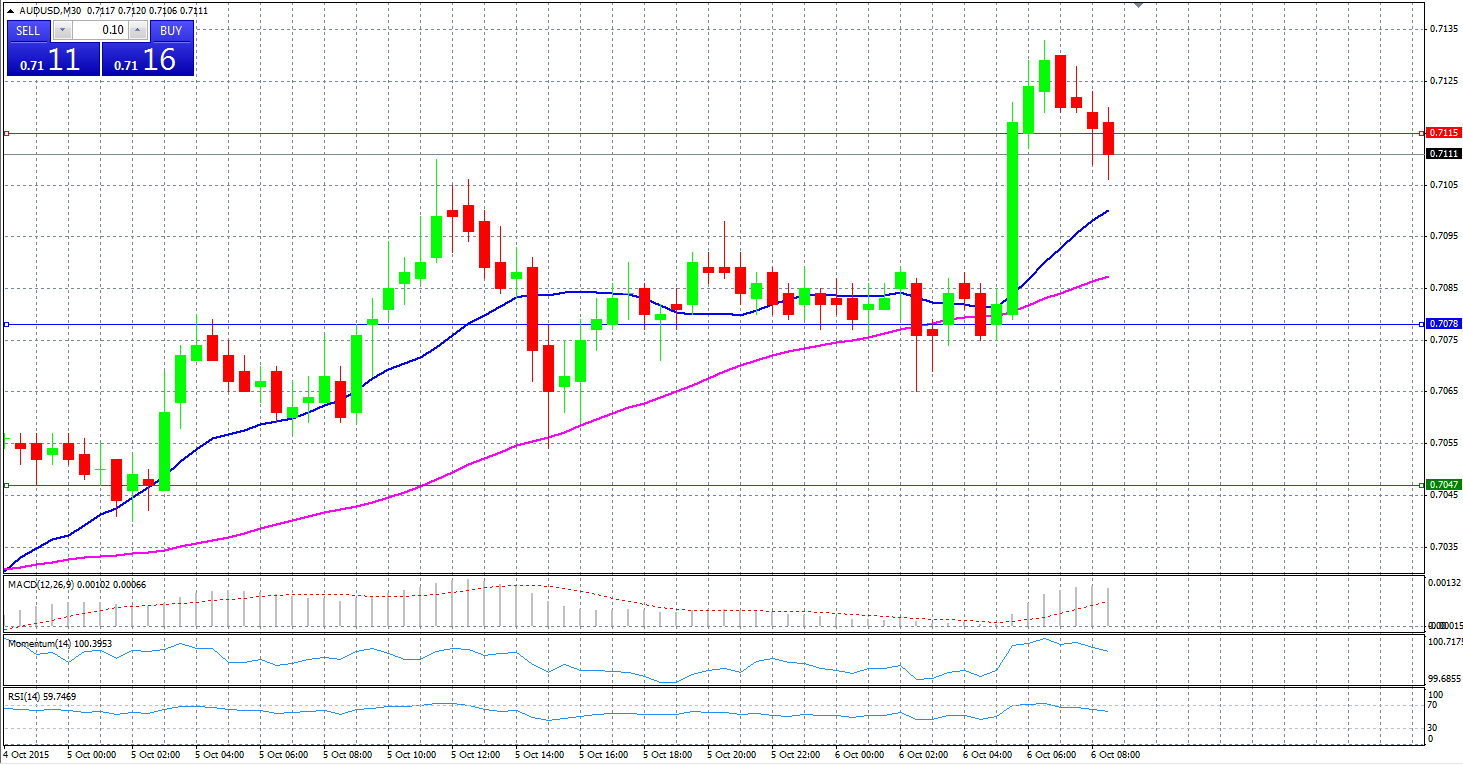
Market Scenario 1: Long positions above 0.7115 with targets at 0.7146 & 0.7183.
Market Scenario 2: Short positions below .7078 with targets at 0.7047 & 0.7010.
Comment: AUD/USD found support at Pivot Point and managed to break through first resistance line. R1 is acting as supporting line. Next targets are R2 and R3
Supports and Resistances:
R3 0.7183
R2 0.7146
R1 0.7115
PP 0.7078
S1 0.7047
S2 0.7010
S3 0.6979
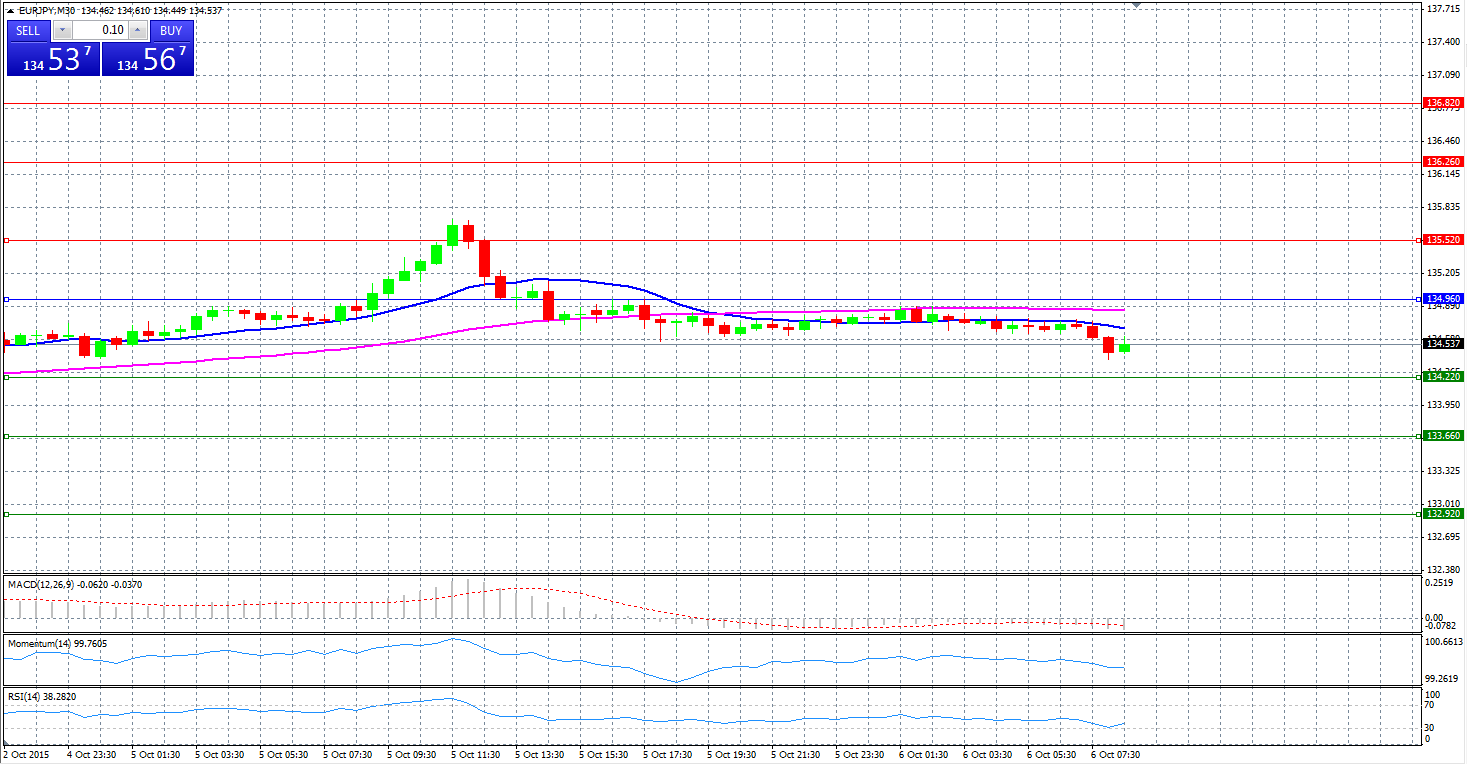
Market Scenario 1: Long positions above 135.52 with targets at 136.26 & 135.52
Market Scenario 2: Short positions below 134.96 with targets at 134.22 & 133.66.
Comment: The pair is trading in a range. Pivot Point is acting as a resistance level. Range – bound strategy can be applied: sell at PP, Buy at S1.
Supports and Resistances:
R3 136.82
R2 136.26
R1 135.52
PP 134.96
S1 134.22
S2 133.66
S3 132.92
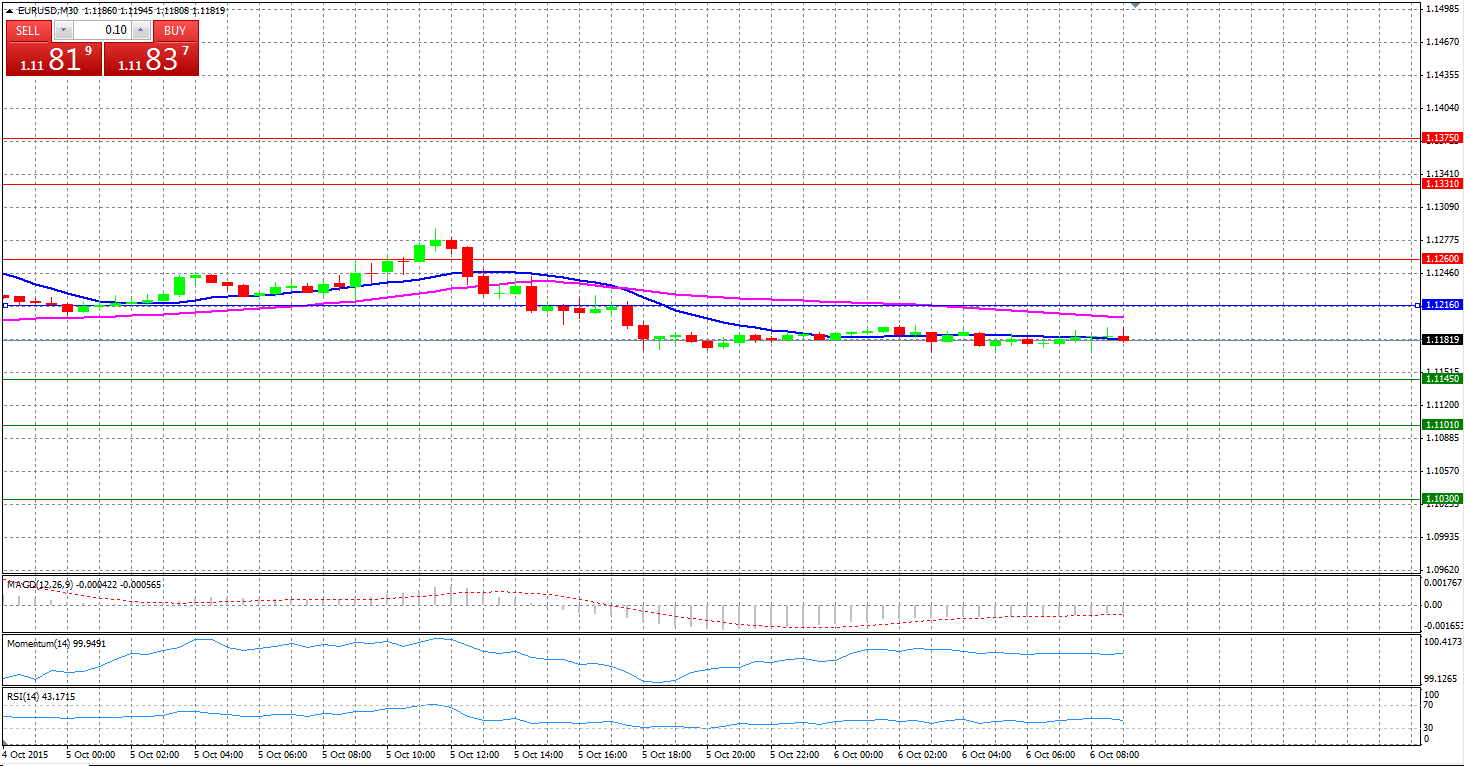
Market Scenario 1: Long positions above 1.1260 with targets at 1.1331 & 1.1375.
Market Scenario 2: Short positions below 1.1145 with targets at 1.1101 & 1.1030.
Comment: Before the speech of ECB president Mario Draghi no volatility is expected. Range - Bound Strategy can be applied. Targets: sell at PP, buy at S1
Supports and Resistances:
R3 1.1375
R2 1.1331
R1 1.1260
PP 1.1216
S1 1.1145
S2 1.1101
S3 1.1030
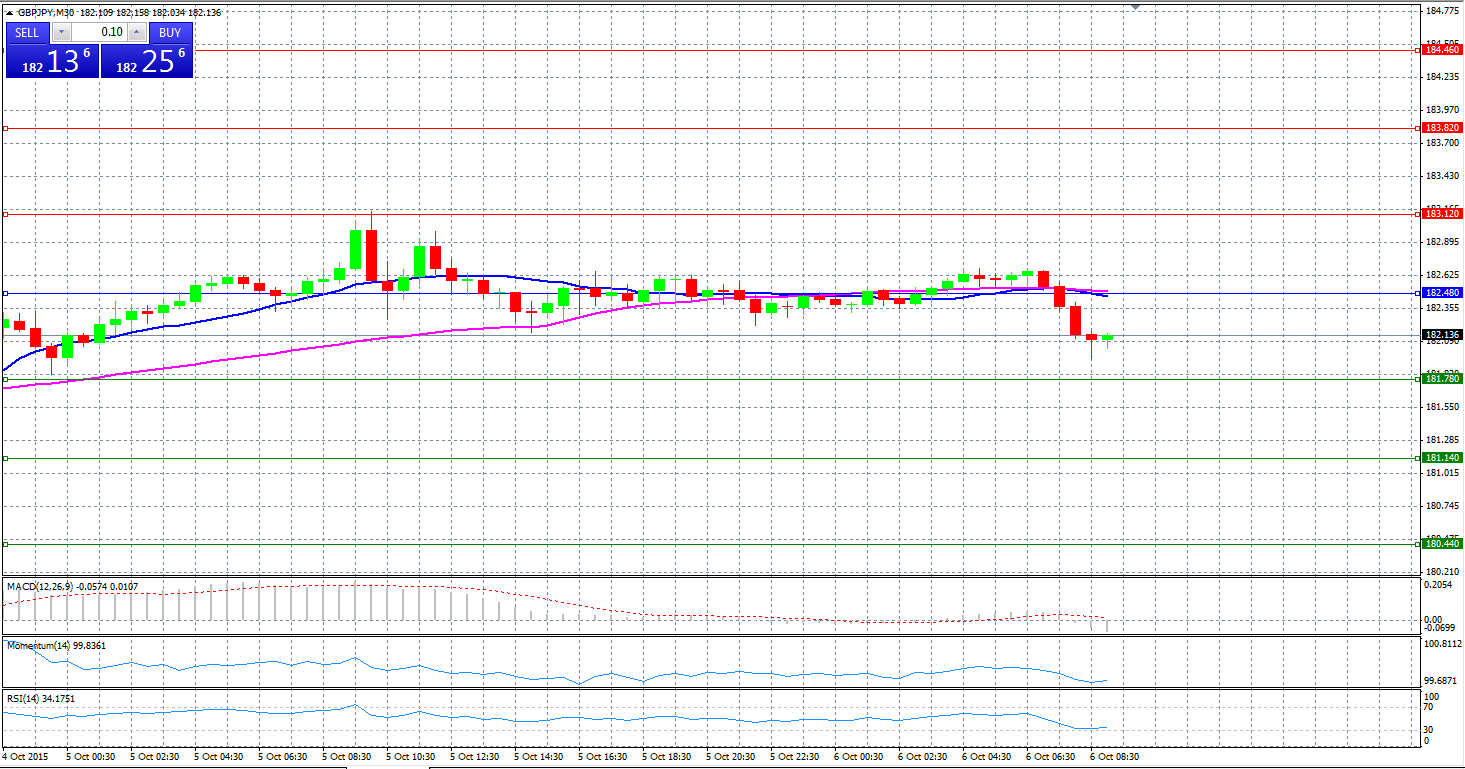
Market Scenario 1: Long positions above 182.48 with targets at 183.12 & 183.82.
Market Scenario 2: Short positions below 181.78 with targets at 181.14 & 180.44.
Comment: The pair managed to break through the Pivot Point level and moving towards S1. Successful overcome of S1 will open the way to S2 and S3. Otherwise buy at S1 target PP
Supports and Resistances:
R3 184.46
R2 183.82
R1 183.12
PP 182.48
S1 181.78
S2 181.14
S3 180.44
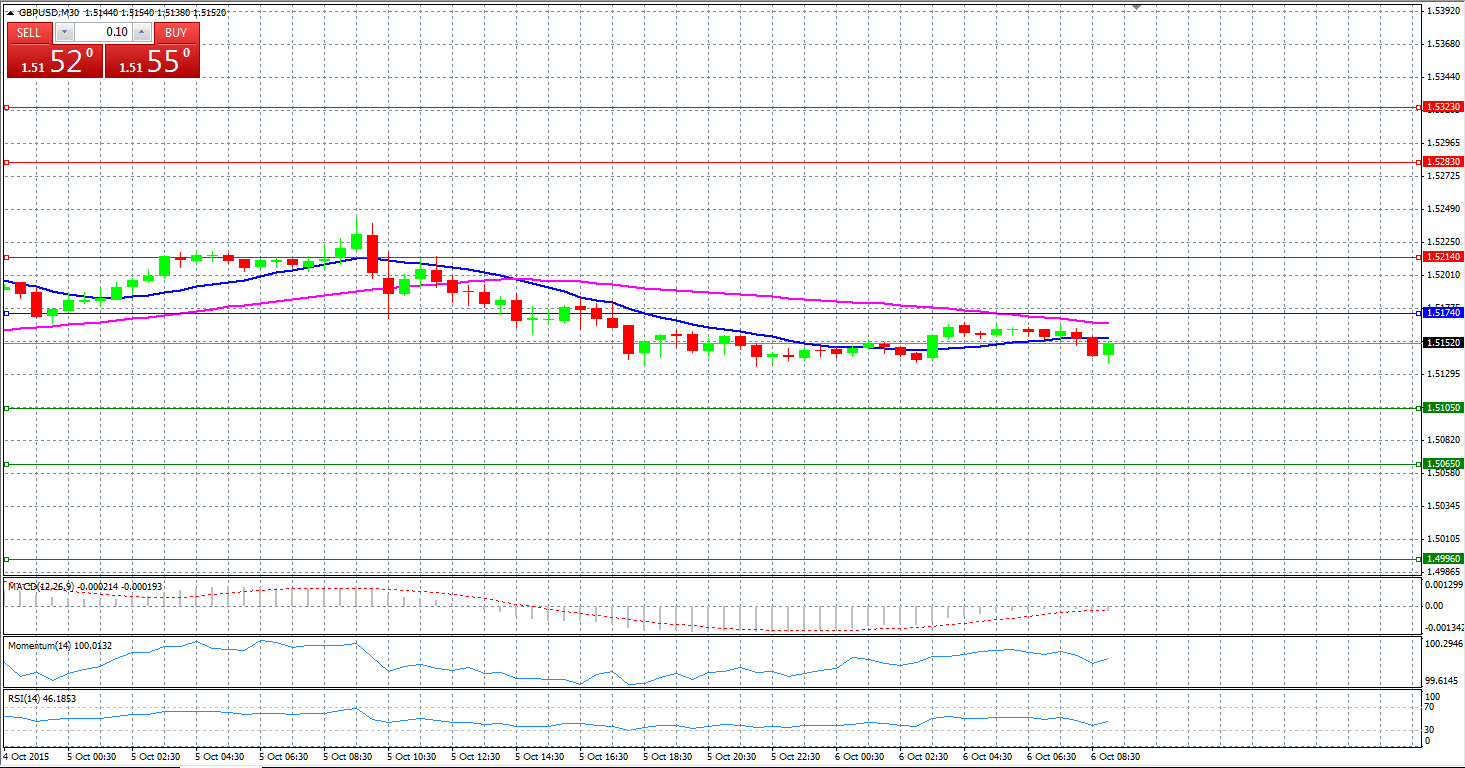
Market Scenario 1: Long positions above 1.5214 with targets at 1.5283 & 1.5323
Market Scenario 2: Short positions below 1.5174 with targets at 1.5105 & 1.5065.
Comment: GBP/USD is in a downtrend trading below PP. PP and R1 are very strong resistance level.
Supports and Resistances:
R3 1.5323
R2 1.5283
R1 1.5214
PP 1.5174
S1 1.5105
S2 1.5065
S3 1.4996
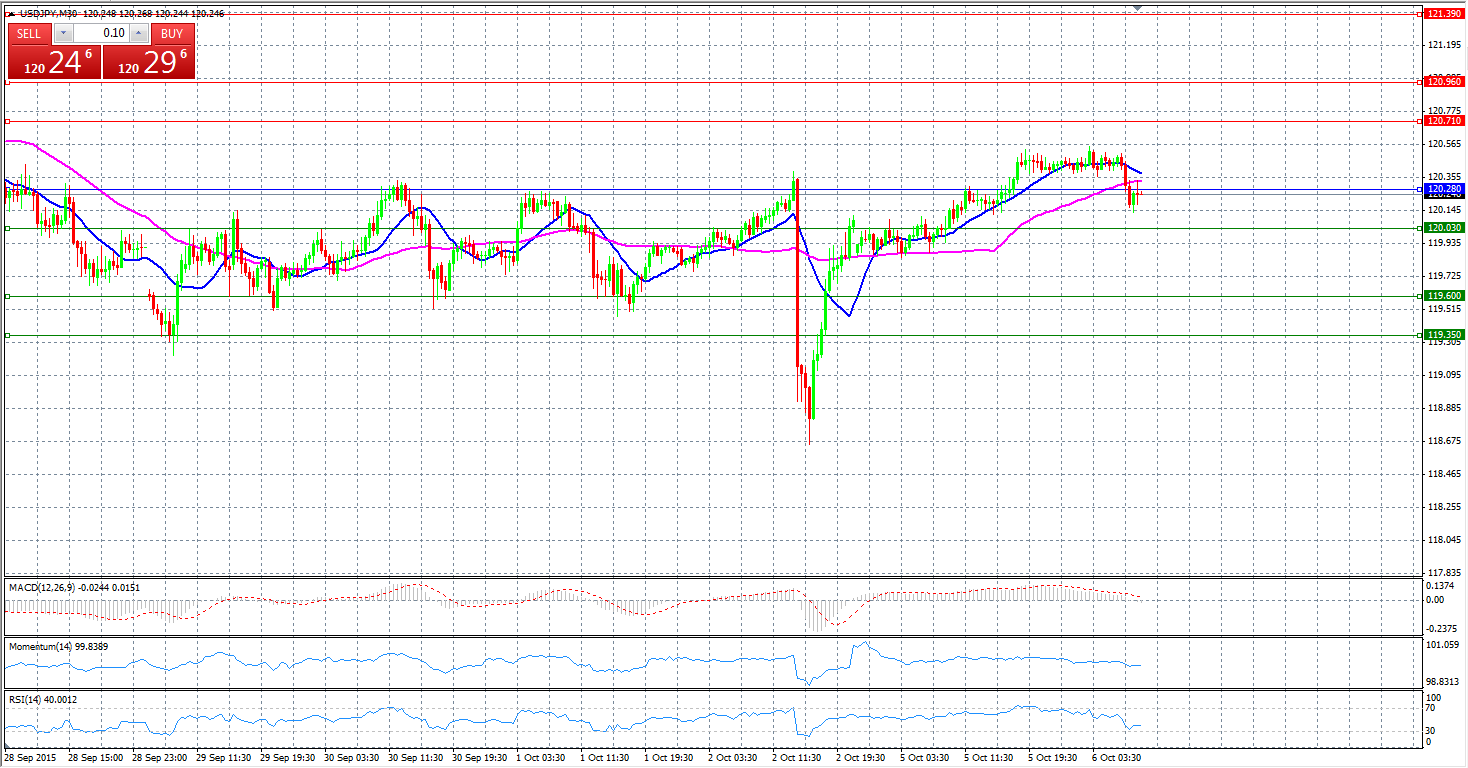
Market Scenario 1: Long positions above 120.71 with targets at 120.96 & 121.39.
Market Scenario 2: Short positions below 119.60 with targets at 119.35 & 119
Comment: The pair is trading in a big aisle between S3 and R2. Range –Bound Strategy can be applied.
Supports and Resistances:
R3 121.39
R2 120.96
R1 120.71
PP 120.28
S1 120.03
S2 119.60
S3 119.35
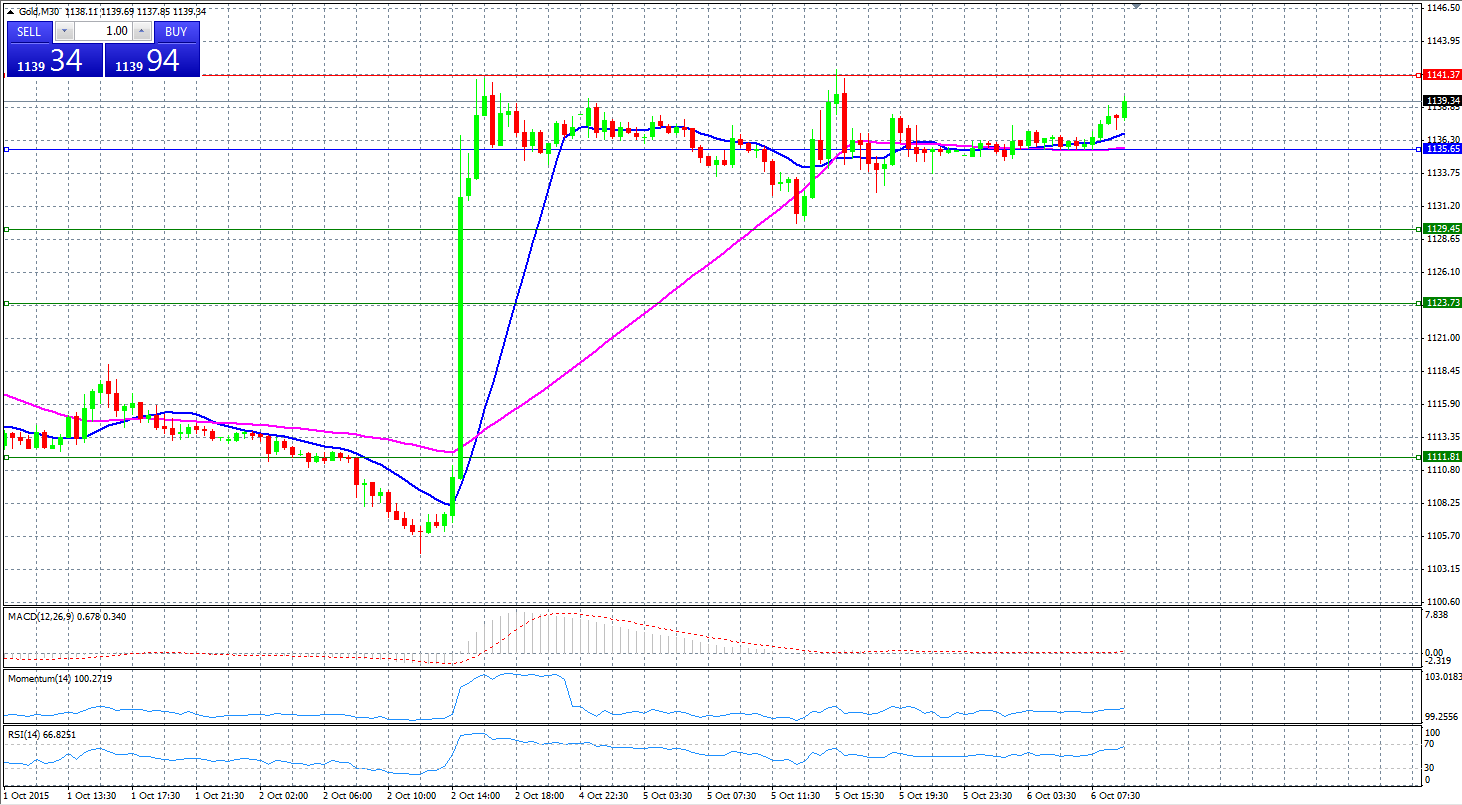
Market Scenario 1: Long positions above 1141.37 with targets at 1147.57 & 1159.49.
Market Scenario 2: Short positions below 1129.45 with targets at 1123.73 & 1111.81.
Comment: Gold is trading above the Pivot Point Level. R1 managed to withhold Gold prices below 1141.37, however, the pattern between S1 and R1 can form a continuation rectangle.
Supports and Resistances:
R3 1159.49
R2 1147.57
R1 1141.37
PP 1135.65
S1 1129.45
S2 1123.73
S3 1111.81
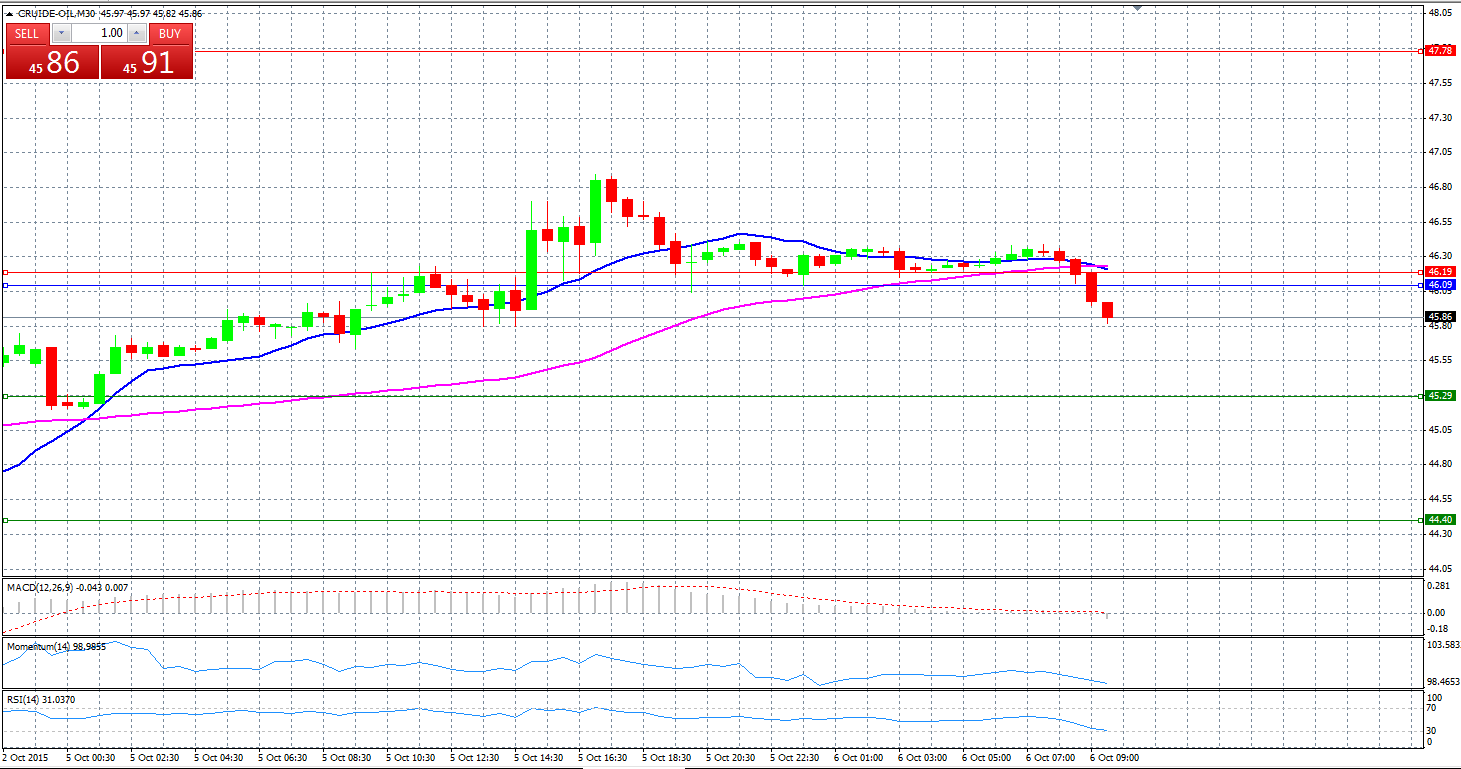
CRUDE OIL
Market Scenario 1: Long positions above 46.19 with targets at 47.78 & 49.47.
Market Scenario 2: Short positions below 46.09 with targets at 45.29 & 44.40.
Comment: Crude oil prices trade on a softer tone as investors kept a close watch on oil-supply data and key macroeconomic indicators for cues.
Supports and Resistances:
R3 49.47
R2 47.78
R1 46.19
PP 46.09
S1 45.29
S2 44.40
S3 42.71
Market Scenario 1: Long positions above 64.10 with targets at 67.20 & 70.30.
Market Scenario 2: Short positions below 64.10with targets at 62.08 & 61.00.
Comment: The pair succeeded to break through Pivot Point which was acting as a Resistance level. Next Target is R1 strong resistance level.
Supports and Resistances:
R3 70.30
R2 67.20
R1 65.18
PP 64.10
S1 62.08
S2 61.00
S3 57.90

