*All the charts are 30M charts with daily pivot points.
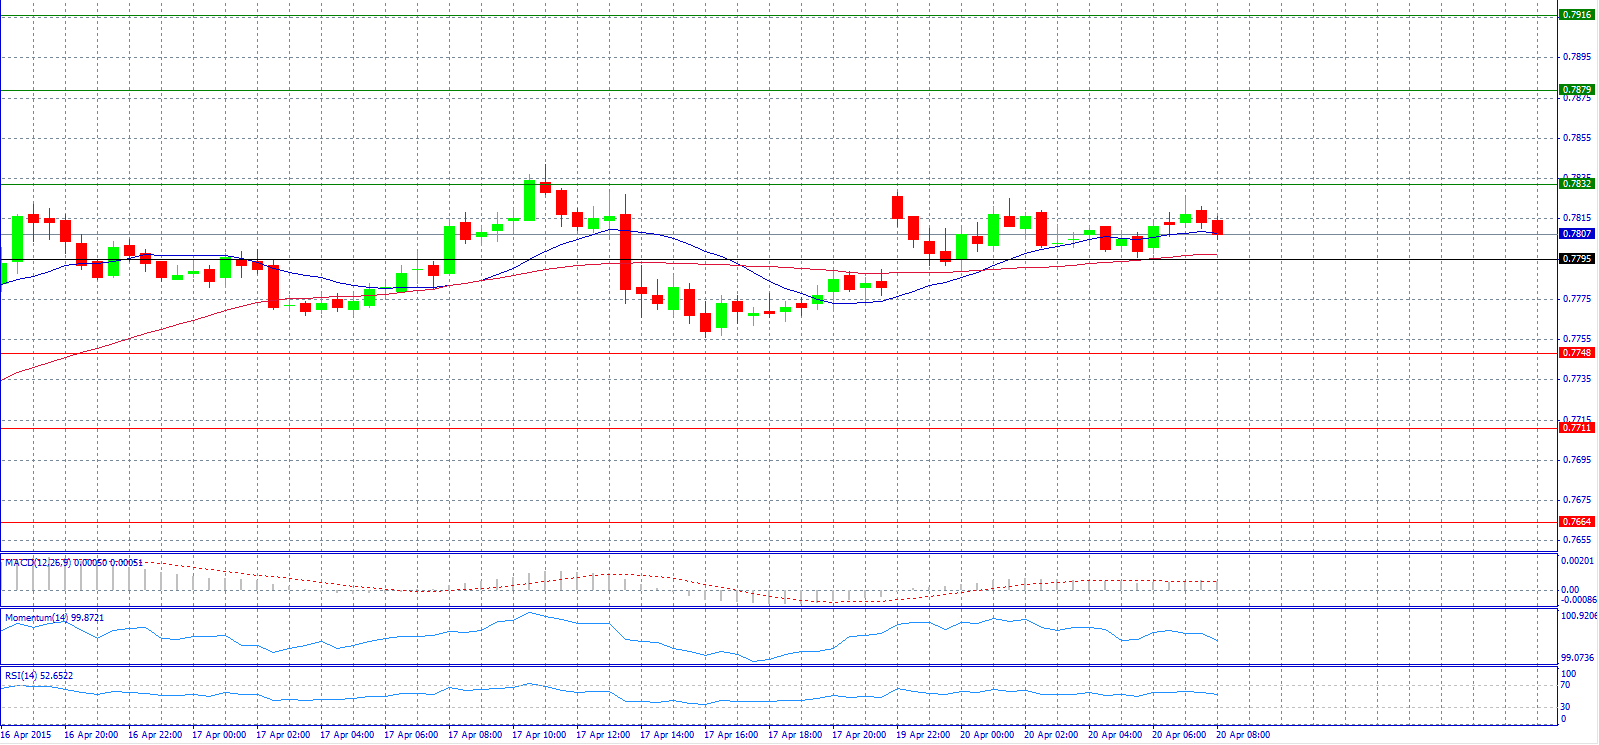
Market Scenario 1: Long positions above 0.7832 with target @ 0.7879.
Market Scenario 2: Short positions below 0.7795 with target @ 0.7748.
Comment: The pair trades in a range above the support level 0.7795 and also with the RSI showing a level near 50 to confirm it.
Supports and Resistances:
R3 0.7916
R2 0.7879
R1 0.7832
PP 0.7795
S1 0.7748
S2 0.7711
S3 0.7664
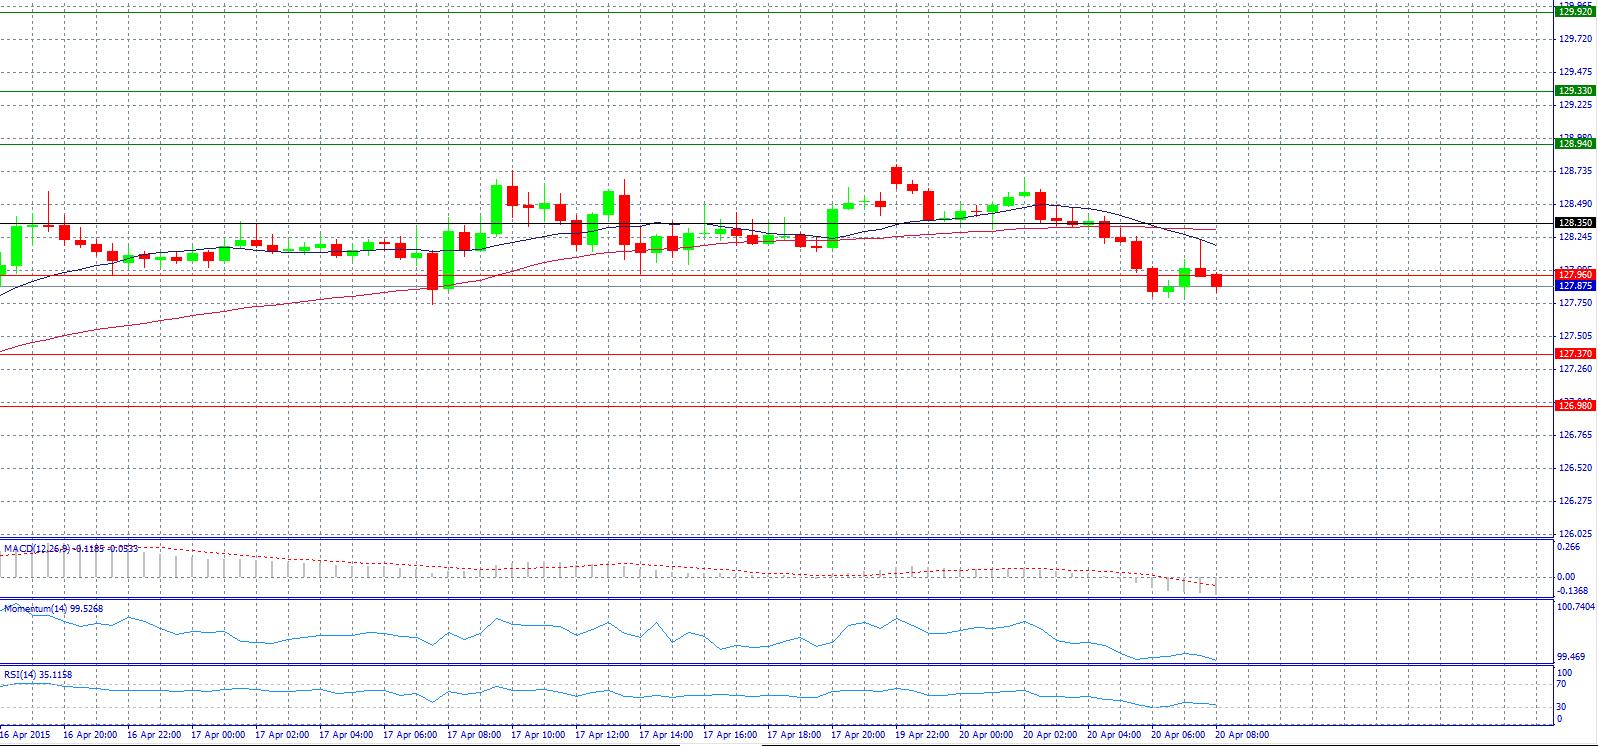
Market Scenario 1: Long positions above 127.96 with target @ 128.35.
Market Scenario 2: Short positions below 127.96 with target @ 127.37.
Comment: The pair is bearish since the opening of the markets and currently trading near the support level 127.96.
Supports and Resistances:
R3 129.92
R2 129.33
R1 128.94
PP 128.35
S1 127.96
S2 127.37
S3 126.98
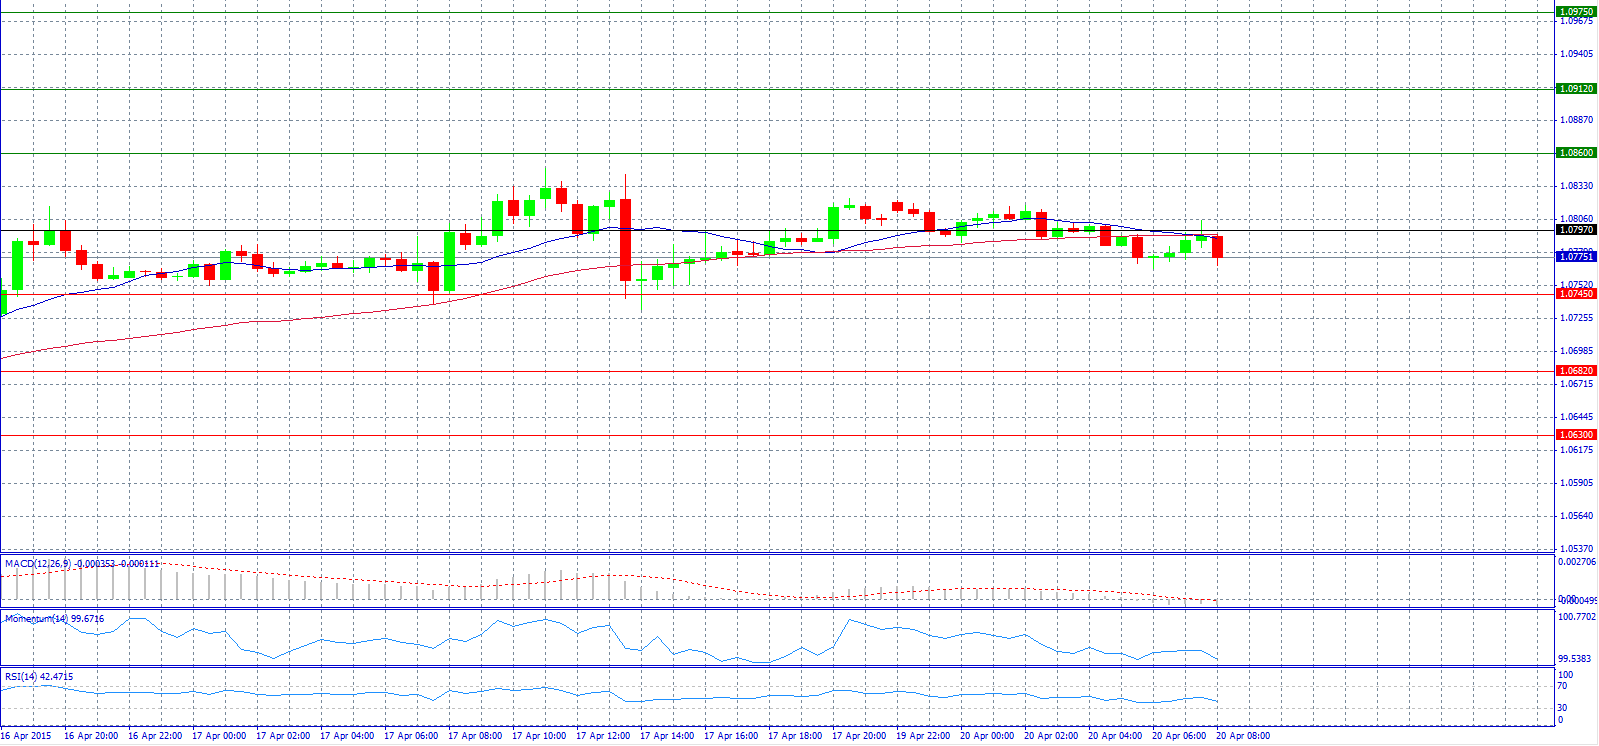
Market Scenario 1: Long positions above 1.0797 with target @ 1.0860.
Market Scenario 2: Short positions below 1.0745 with target @ 1.0682.
Comment: The pair tries to break the resistance level 1.0797 but fails and trades in a steady mode.
Supports and Resistances:
R3 1.0975
R2 1.0912
R1 1.0860
PP 1.0797
S1 1.0745
S2 1.0682
S3 1.0630
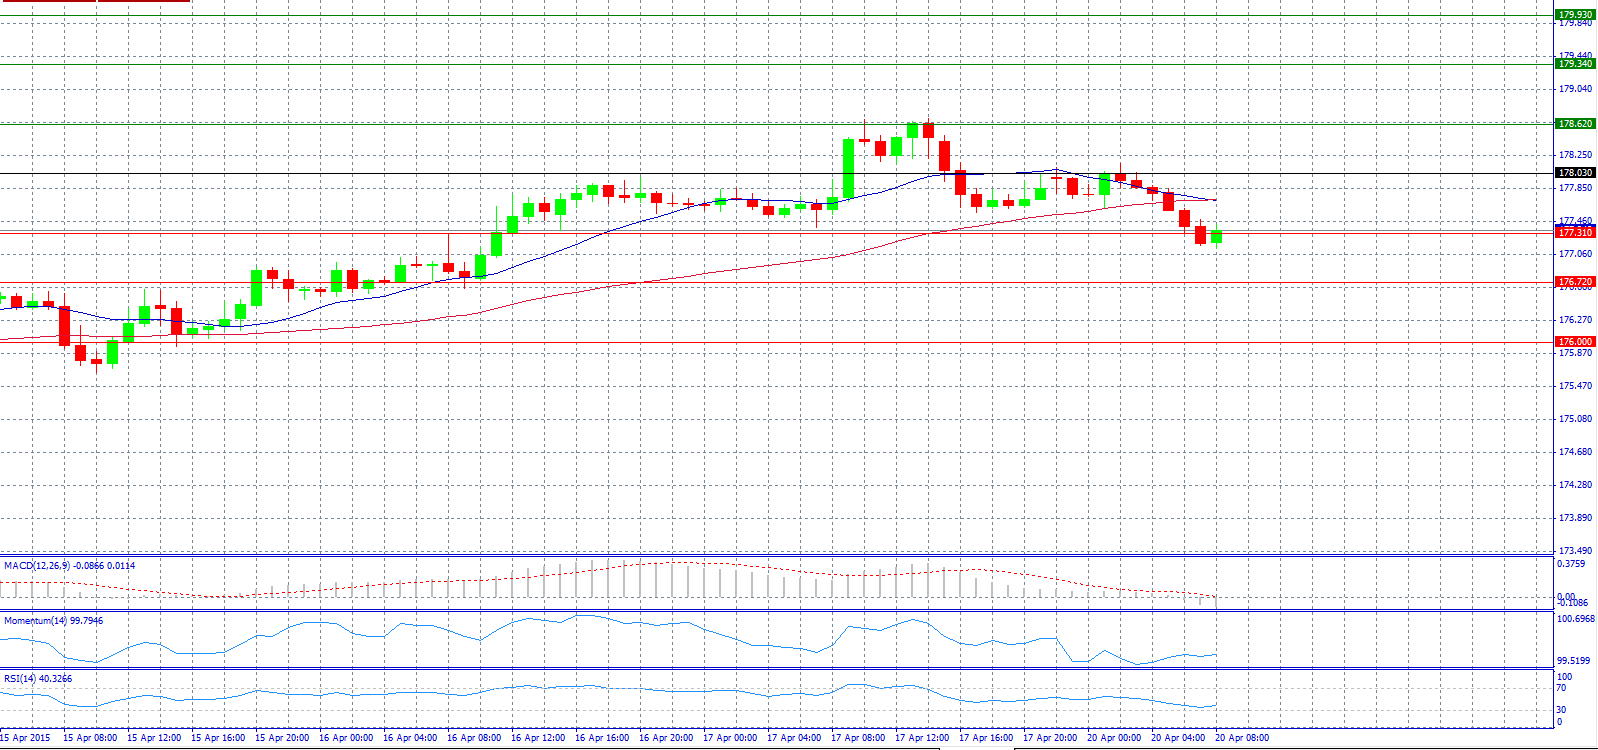
Market Scenario 1: Long positions above 177.31 with target @ 178.03.
Market Scenario 2: Short positions below 177.31 with target @ 176.72.
Comment: The pair weakened and trades near support level 177.31 but with the RSI near 40 it might be a signal for a bullish reversal.
Supports and Resistances:
R3 179.93
R2 179.34
R1 178.62
PP 178.03
S1 177.31
S2 176.72
S3 176.00
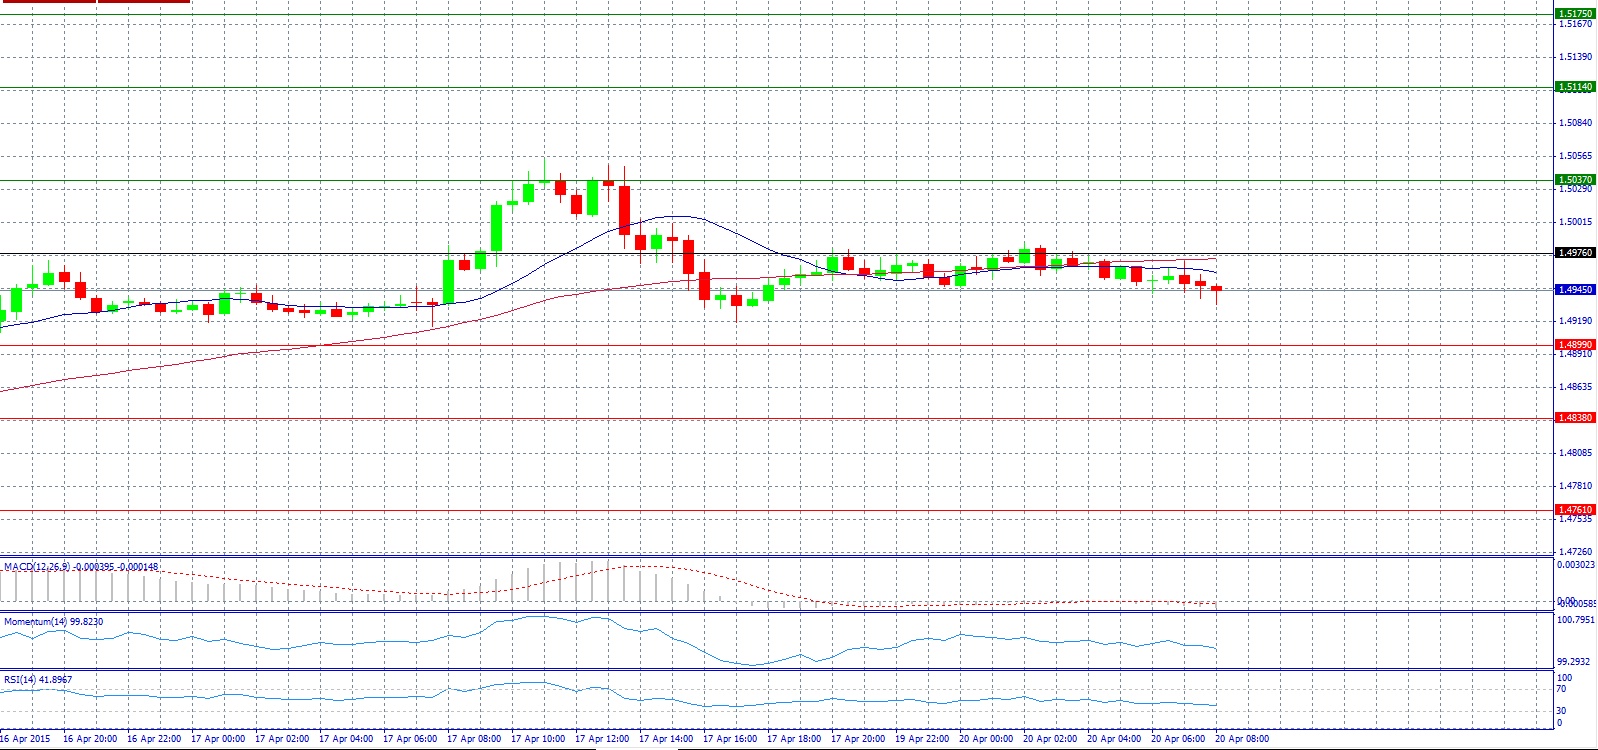
Market Scenario 1: Long positions above 1.4976 with target @ 1.5037.
Market Scenario 2: Short positions below 1.4899 with target @ 1.4838.
Comment: The pair has a bearish tone and trades below 1.4950 level.
Supports and Resistances:
R3 1.5175
R2 1.5114
R1 1.5037
PP 1.4976
S1 1.4899
S2 1.4838
S3 1.4761
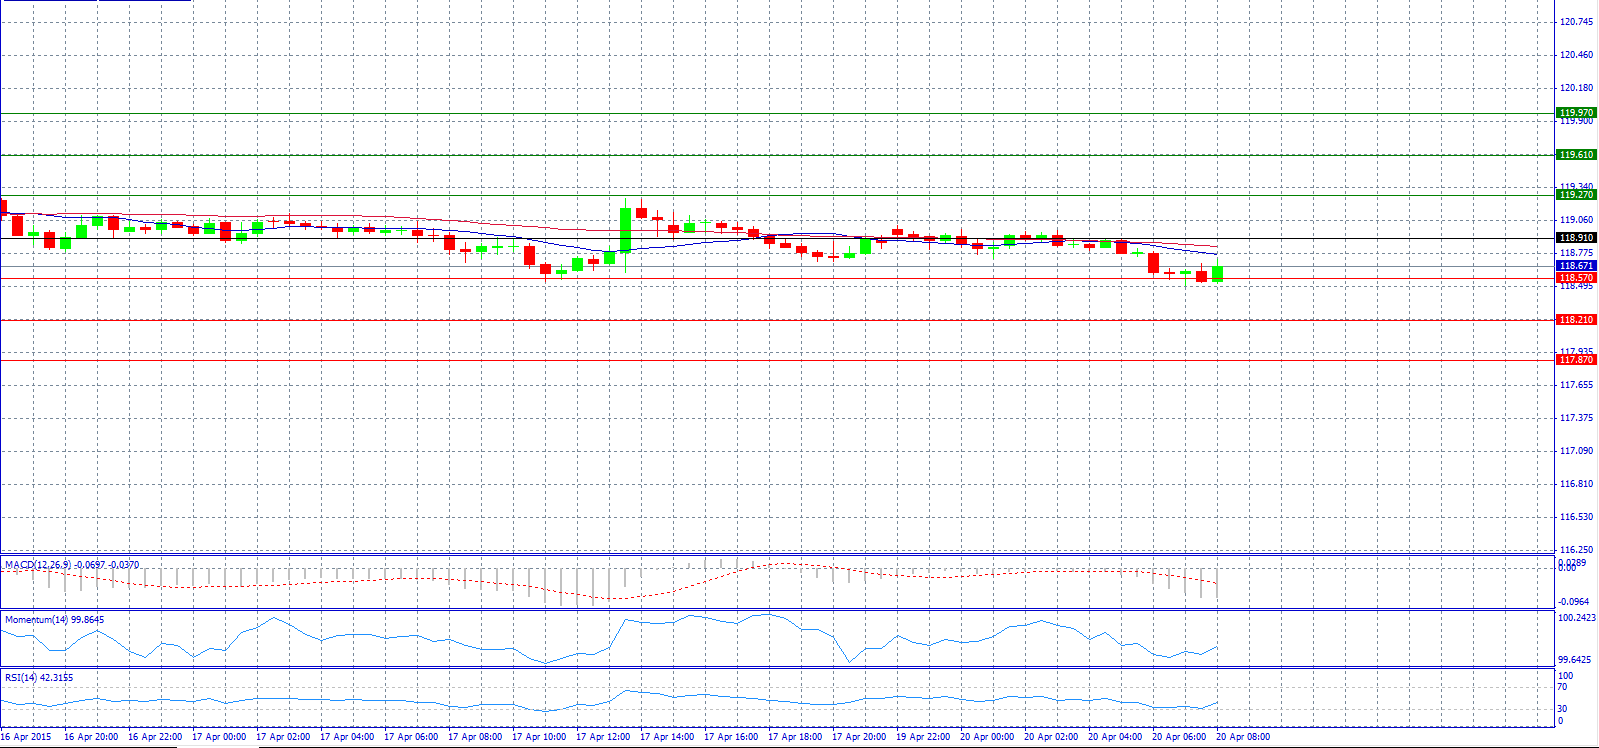
Market Scenario 1: Long positions above 118.91 with target @ 119.27.
Market Scenario 2: Short positions below 118.57 with target @ 118.21.
Comment: The pair might rebounce as it reached support level 118.57 and with the RSI near 40.
Supports and Resistances:
R3 119.97
R2 119.61
R1 119.27
PP 118.91
S1 118.57
S2 118.21
S3 117.87
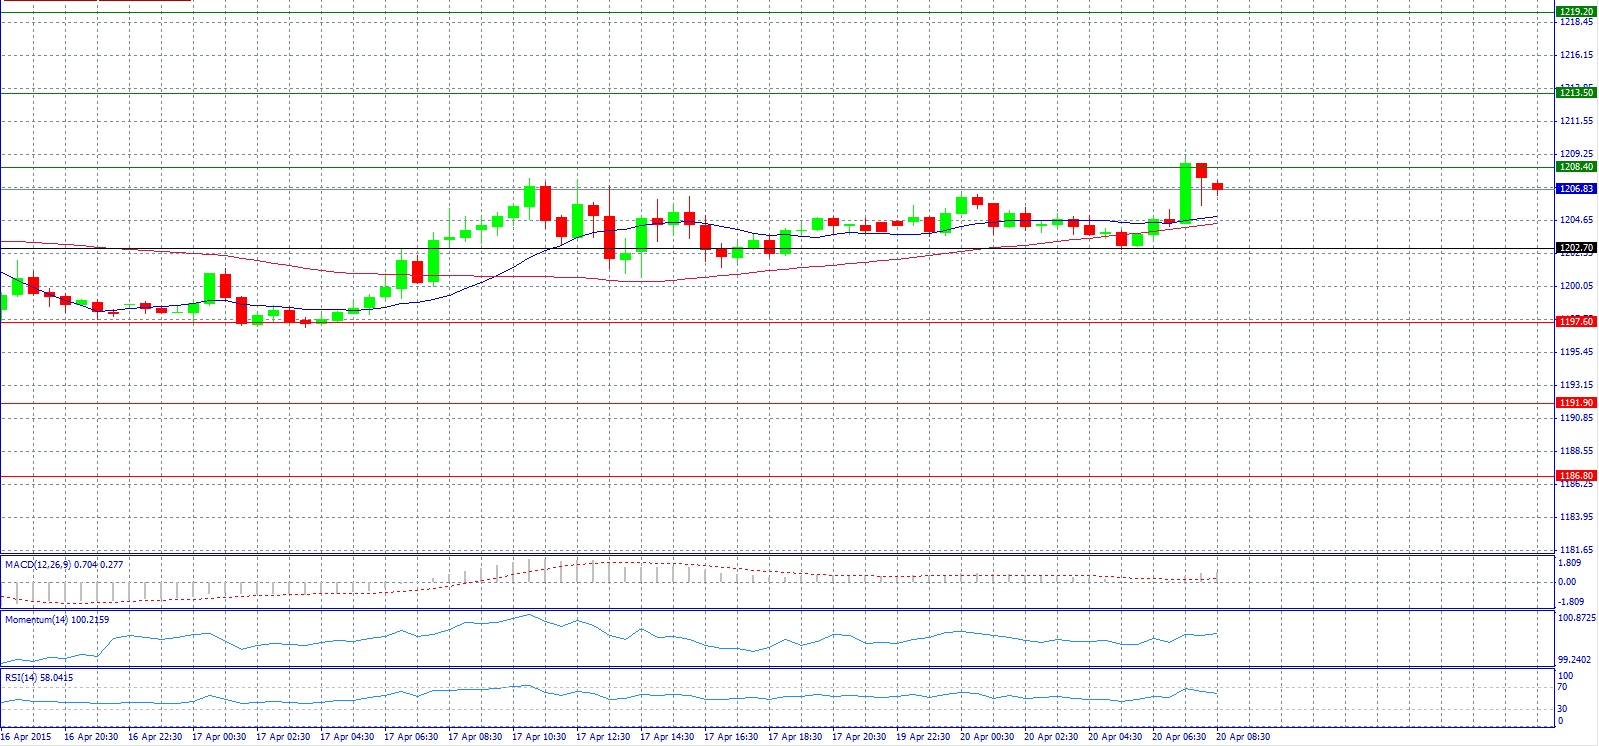
Market Scenario 1: Long positions above 1208.40 with target @ 1213.50.
Market Scenario 2: Short positions below 1202.70 with target @ 1197.60.
Comment: Gold prices jumped in the morning but found resistance at 1208.40 level.
Supports and Resistances:
R3 1219.20
R2 1213.50
R1 1208.40
PP 1202.70
S1 1197.60
S2 1191.90
S3 1186.80
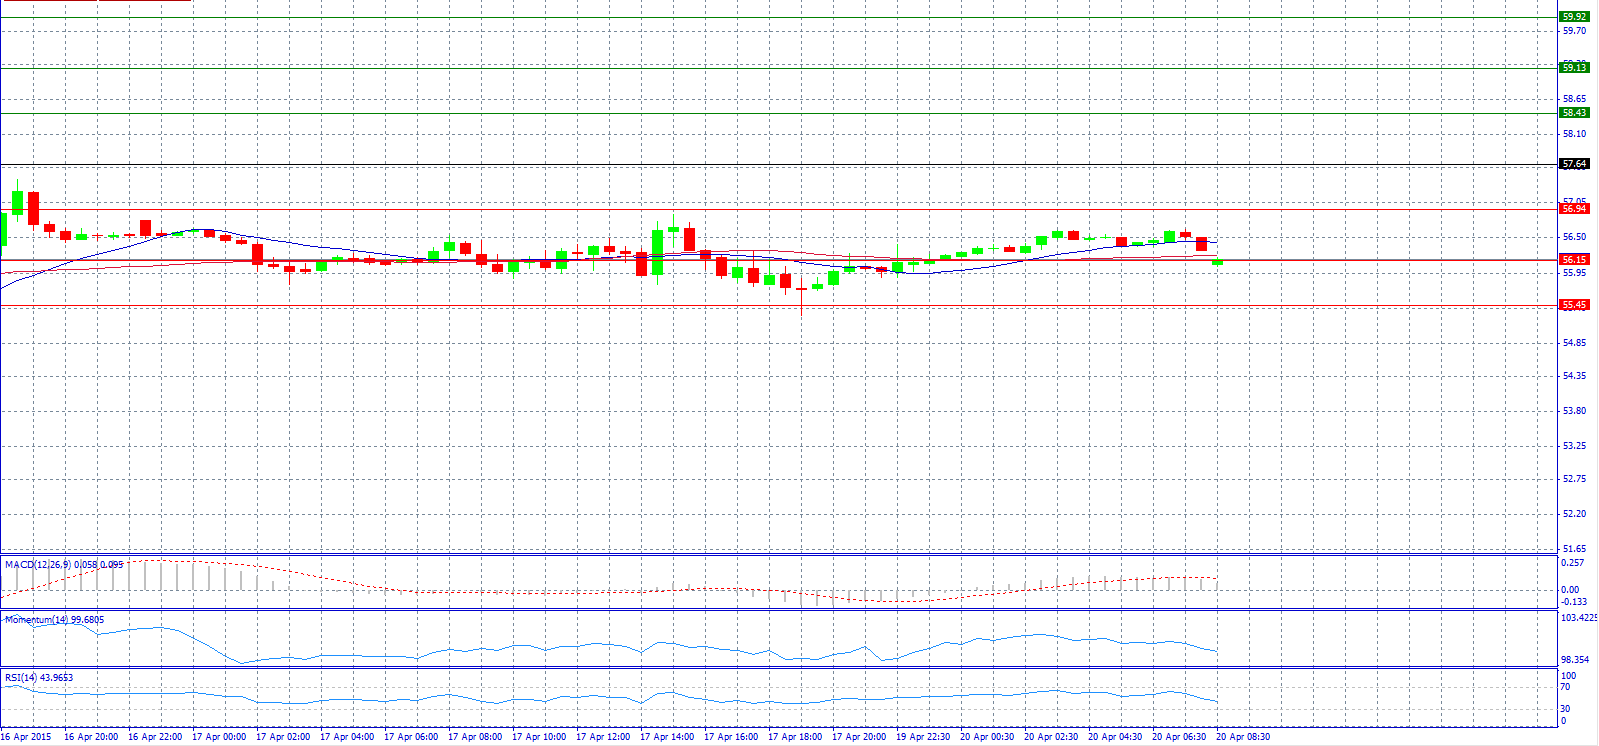
Market Scenario 1: Long positions above 56.15 with target @ 56.94.
Market Scenario 2: Short positions below 56.15 with target @ 55.45.
Comment: Crude oil prices try to break support level 56.15 but with the RSI near 40 seems difficult.
Supports and Resistances:
R3 59.92
R2 59.13
R1 58.43
PP 57.64
S1 56.94
S2 56.15
S3 55.45
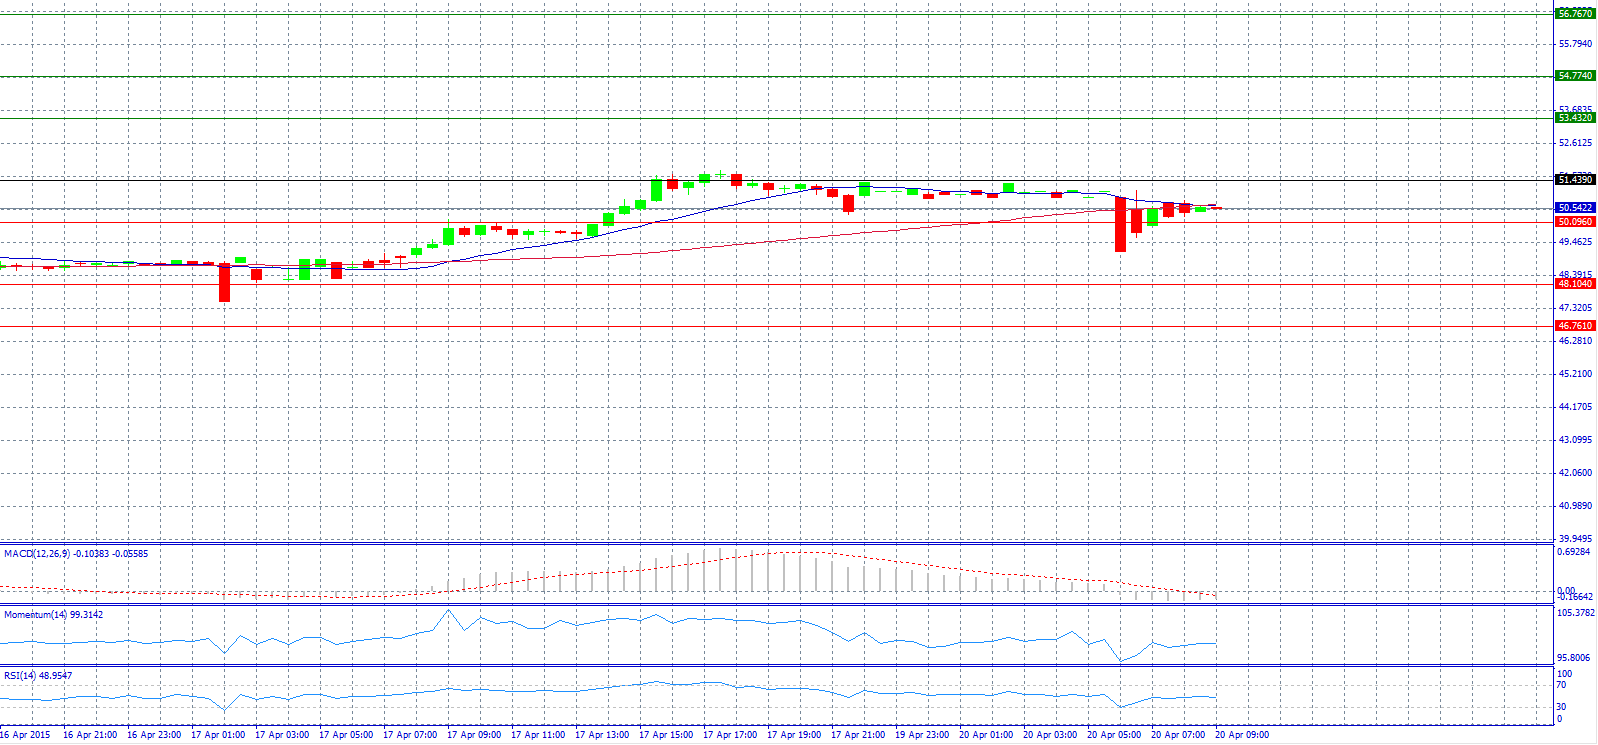
Market Scenario 1: Long positions above 51.439 with target @ 53.432.
Market Scenario 2: Short positions below 50.096 with target @ 48.104.
Comment: The pair fell sharply in the early morning at 49.163 level but now is advancing again steady.
Supports and Resistances:
R3 56.767
R2 54.774
R1 53.432
PP 51.439
S1 50.096
S2 48.104
S3 46.761
