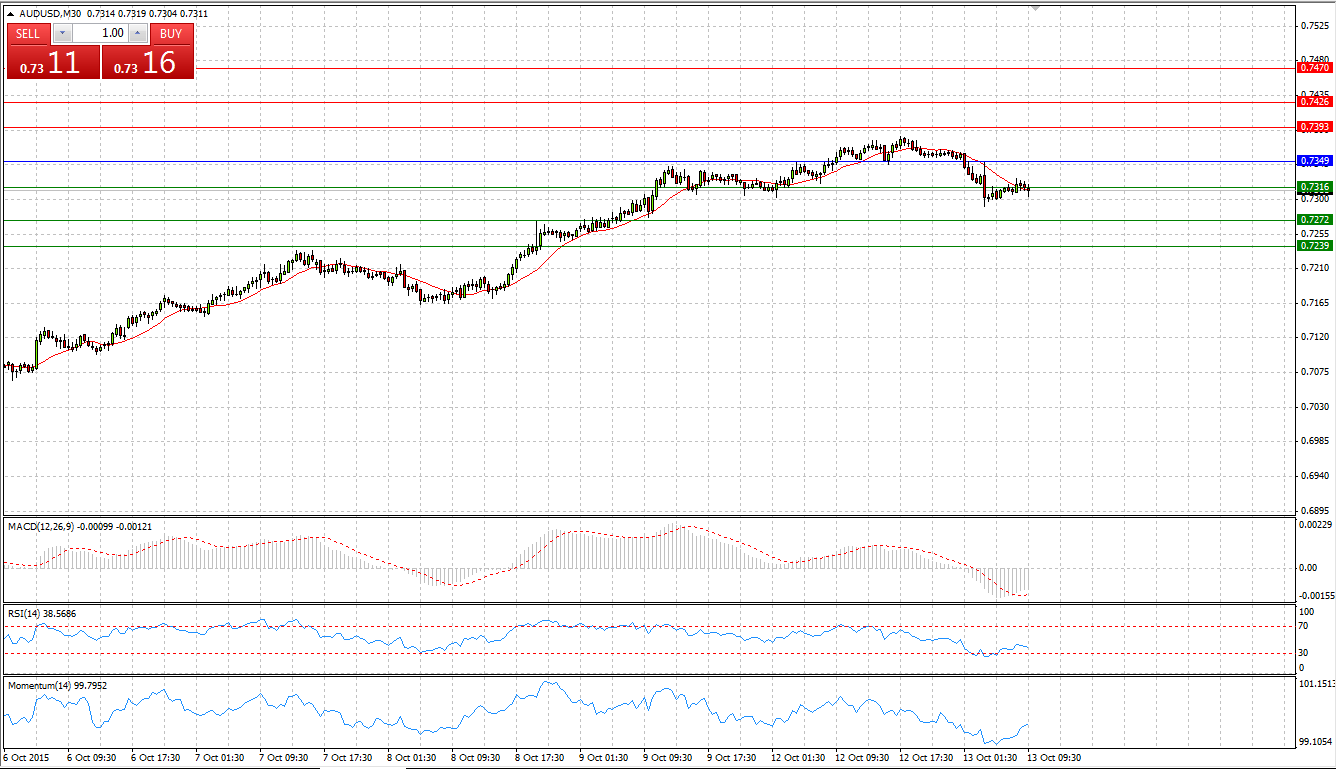
Market Scenario 1: Long positions above 0.7316 with targets at 0.7349 and 0. 0.7349
Market Scenario 2: Short positions below 0.7316 with targets at 0.7272 and 0.7272
Comment: Aussie surged last week against US dollar, gaining about 300 pips amid dovish Federal Reserve minutes as well as weaker than expected US economic data such as Services PMI and Trade Balance. Having reached its recent high, Aussie encountered with a selling pressure at 0.7382 and was pushed below Pivot Point level. However, in the bigger picture AUD/USD is still in an uptrend. Just slightly overheated due to extensive period of gains. S2 is a strong support level, which stands exactly at 17-18th of October High.
Supports and Resistances:
R3 0.7470
R2 0.7426
R1 0.7393
PP 0.7349
S1 0.7316
S2 0.7272
S3 0.7239
EUR/JPY
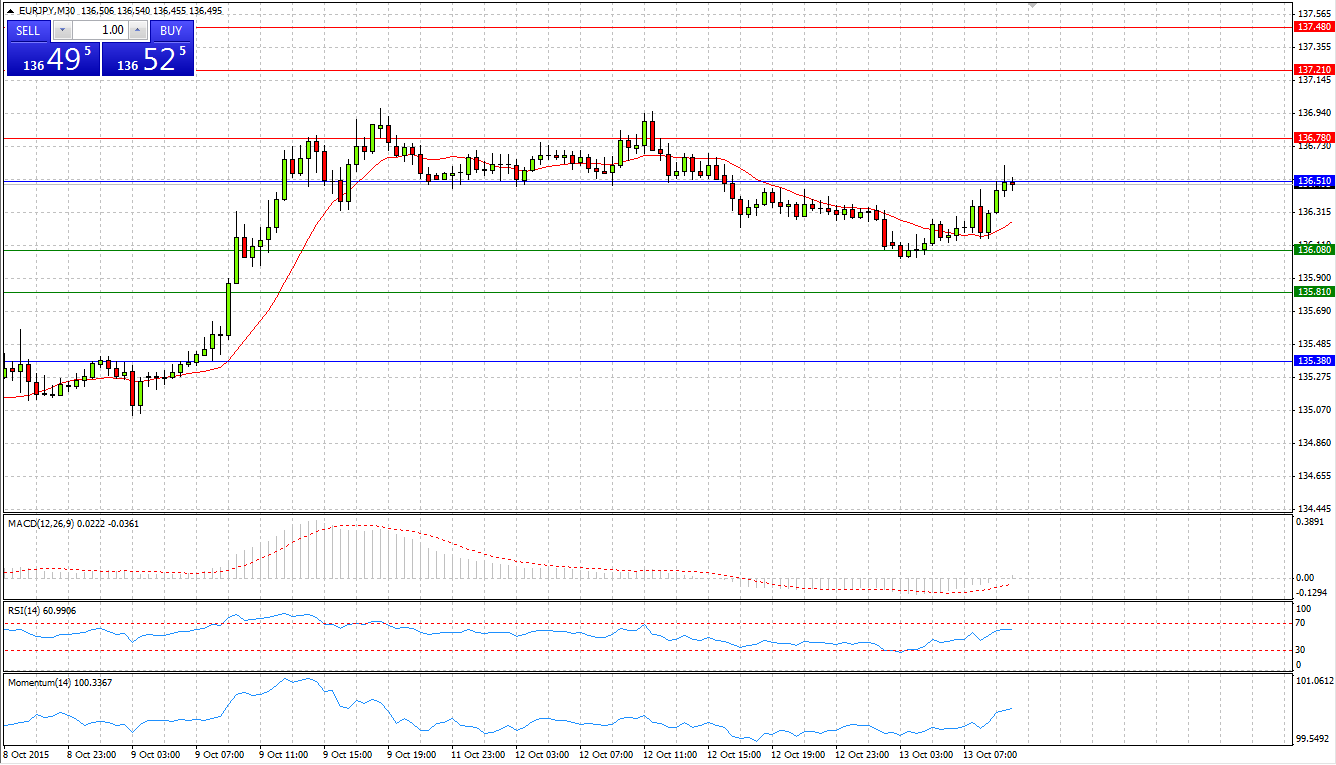
Market Scenario 1: Long positions above 136.08 with targets at 136.51 and 136.78
Market Scenario 2: Short positions below 136.51 with targets at 136.08 and 135.81
Comment: EUR/JPY bulls are currently trying to take back Pivot Point level, which had been taken by bears yesterday. Succeeding to do so EUR/JPY might undertake another attempt to break through and entrench itself above recent highs.
R3 137.48
R2 137.21
R1 136.78
PP 136.51
S1 136.08
S2 135.81
S3 135.38
EUR/USD
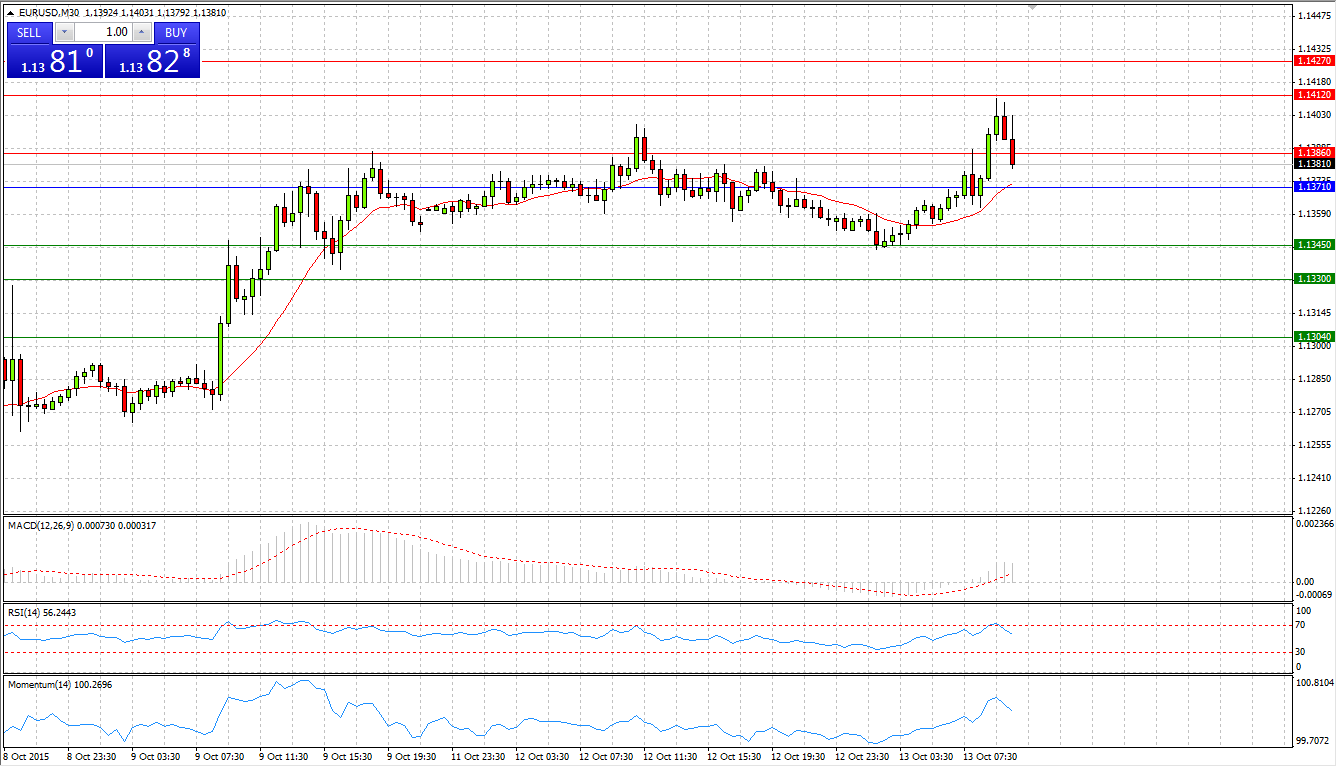
Market Scenario 1: Long positions above 1.1386 with targets at 1.1412 and 1.1427
Market Scenario 2: Short positions below 1.1386 with targets at 1.1345 and 1.1345
Comment: EUR/USD managed to break through its recent high at 1.1391 and now testing second resistance level. Successful break out through this level will lead to further appreciation of European currency against US dollar.
Supports and Resistances:
R3 1.1427
R2 1.1412
R1 1.1386
PP 1.1371
S1 1.1345
S2 1.1330
S3 1.1304
GBP/JPY
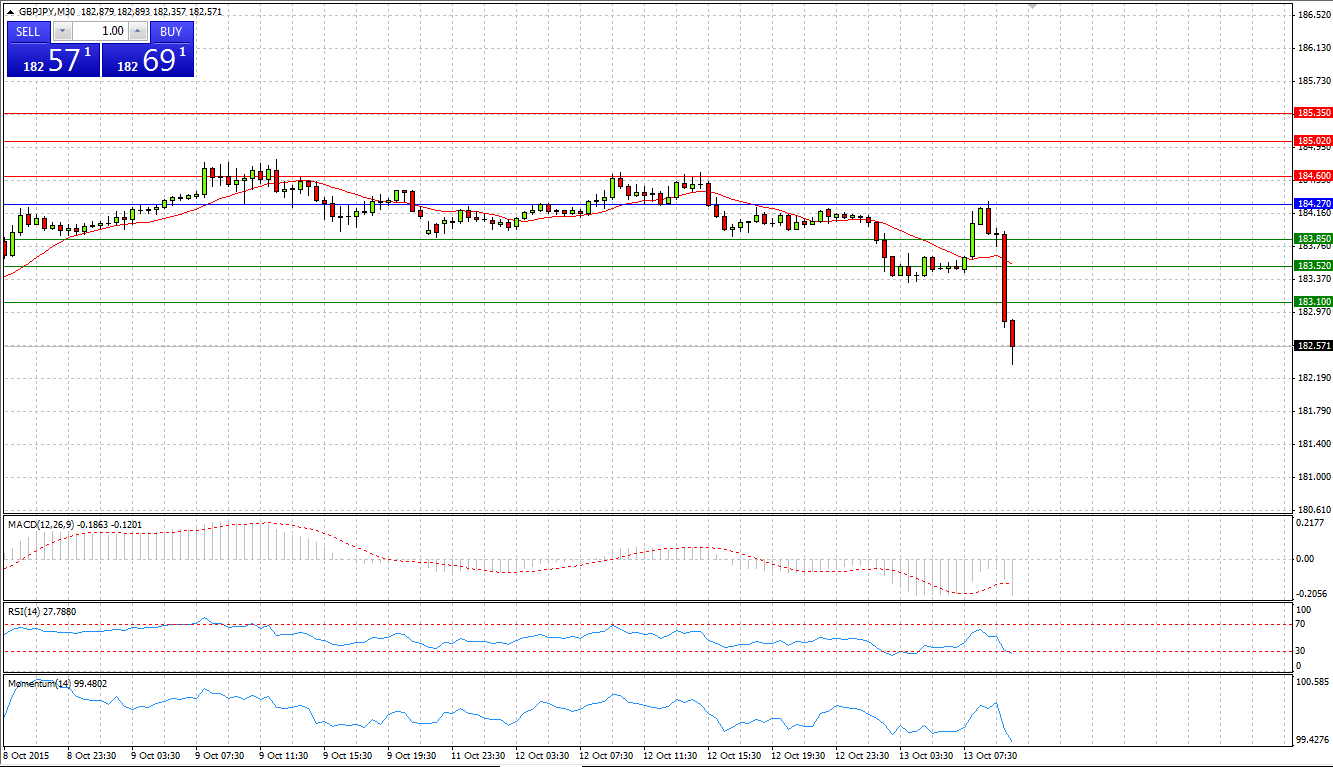
Market Scenario 1: Long positions above 183.10 with targets at 183.52 and 183.85
Market Scenario 2: Short positions below 183.10 with targets at 182 and 181
Comment: GBP/JPY didn’t succeed to break through first resistance level and was pushed below Pivot Point Level. Then, just 5 minutes ahead of the release of UK CPI, bulls apparently realized their profit, making GBP to depreciate even further.
Supports and Resistances:
R3 185.35
R2 185.02
R1 184.60
PP 184.27
S1 183.85
S2 183.52
S3 183.10
GBP/USD
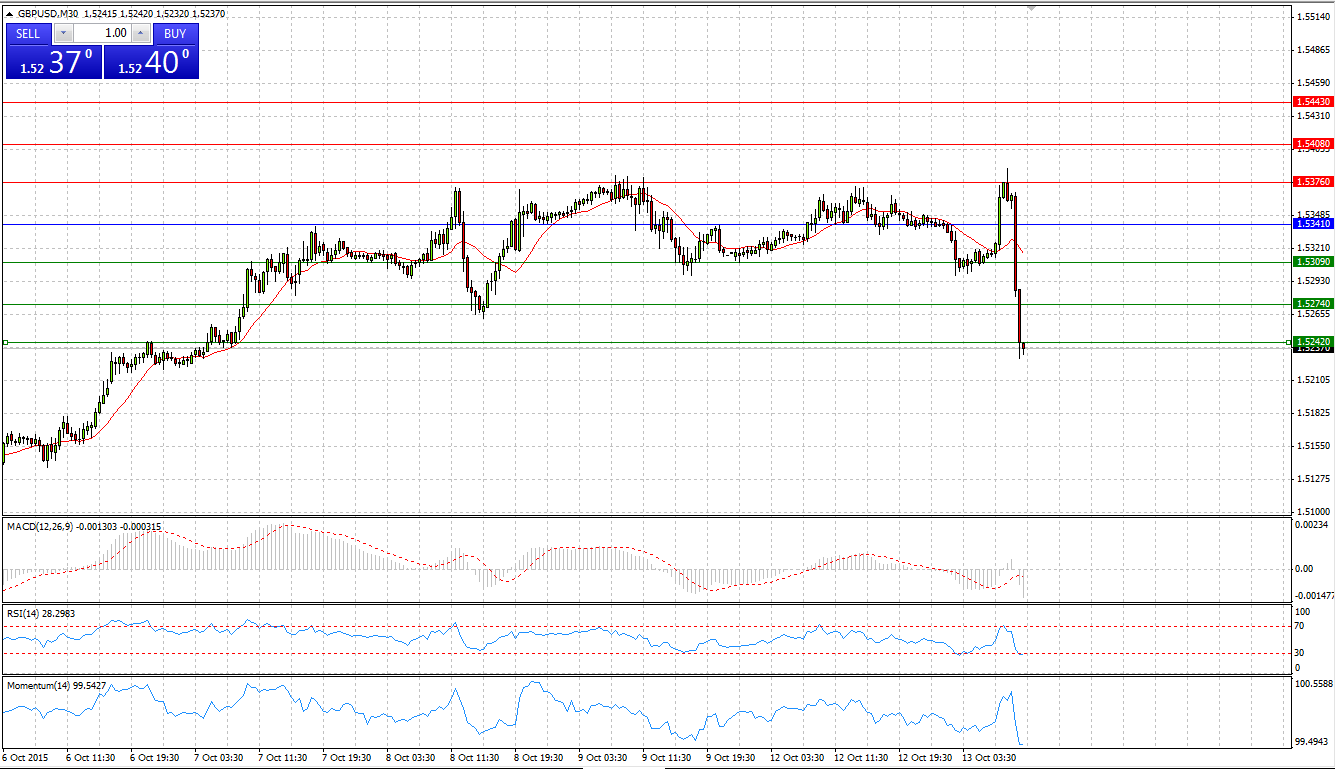
Market Scenario 1: Long positions above 1.5242 with targets at 1.5274 and 1.5309
Market Scenario 2: Short positions below 1.5274 with targets at 1.5242 and 1.52
Comment: GBP/USD didn’t succeed in breaking through first resistance level after number of attempts, which lasted for the last 4 trading days. As a result of this failure, bulls decided to close and realize their profits, which led to imbalance of selling and buying sides that drove GBP/USD to a drastic selloff.
Supports and Resistances:
R3 1.5443
R2 1.5408
R1 1.5376
PP 1.5341
S1 1.5309
S2 1.5274
S3 1.5242
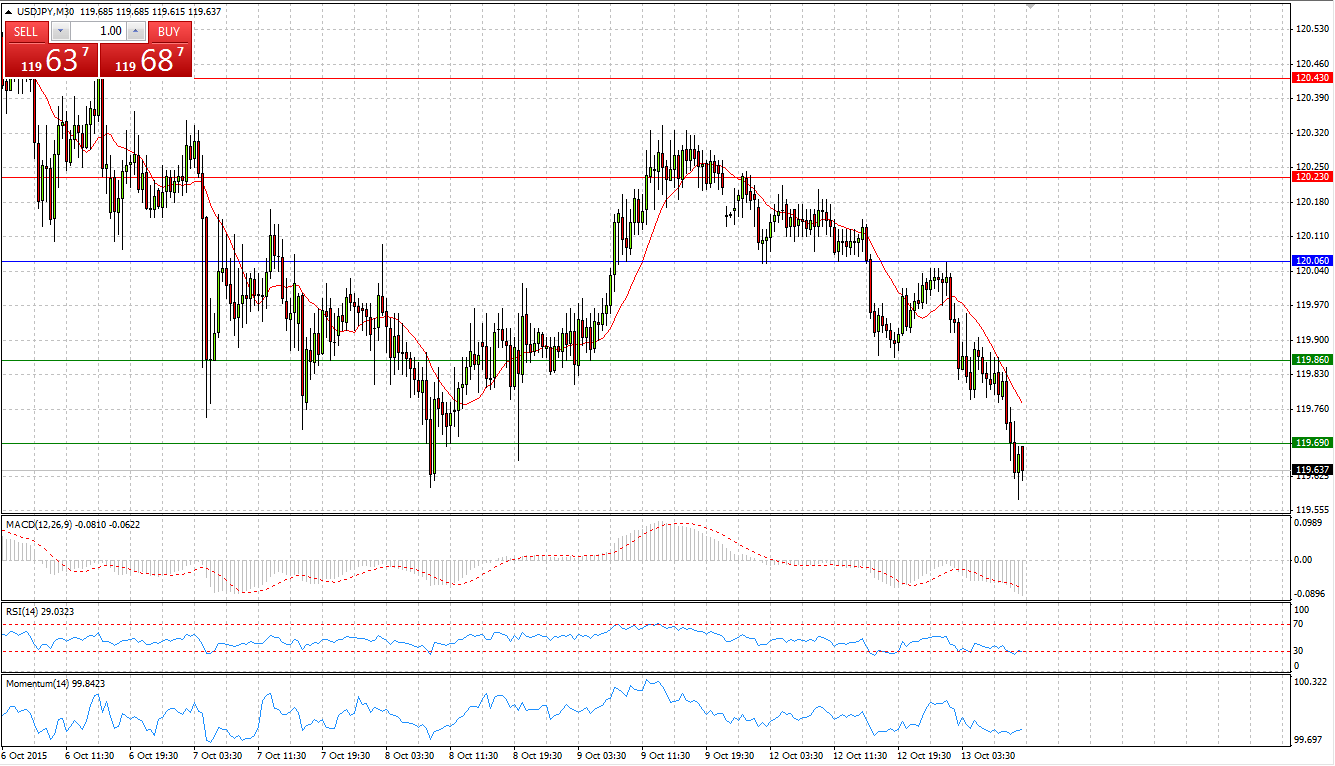
Market Scenario 1: Long positions above 119.49 with targets at 119.69 and 119.86
Market Scenario 2: Short positions below 120.23 with targets at 120.06 and 119.69
Comment: The pair broke through Pivot point Level and tested it as a Resistance level. However, in the bigger picture, the pair continues trading in the range. Hence, Range – Bound strategy can be applied.
Supports and Resistances:
R3 120.60
R2 120.43
R1 120.23
PP 120.06
S1 119.86
S2 119.69
S3 119.49
GOLD
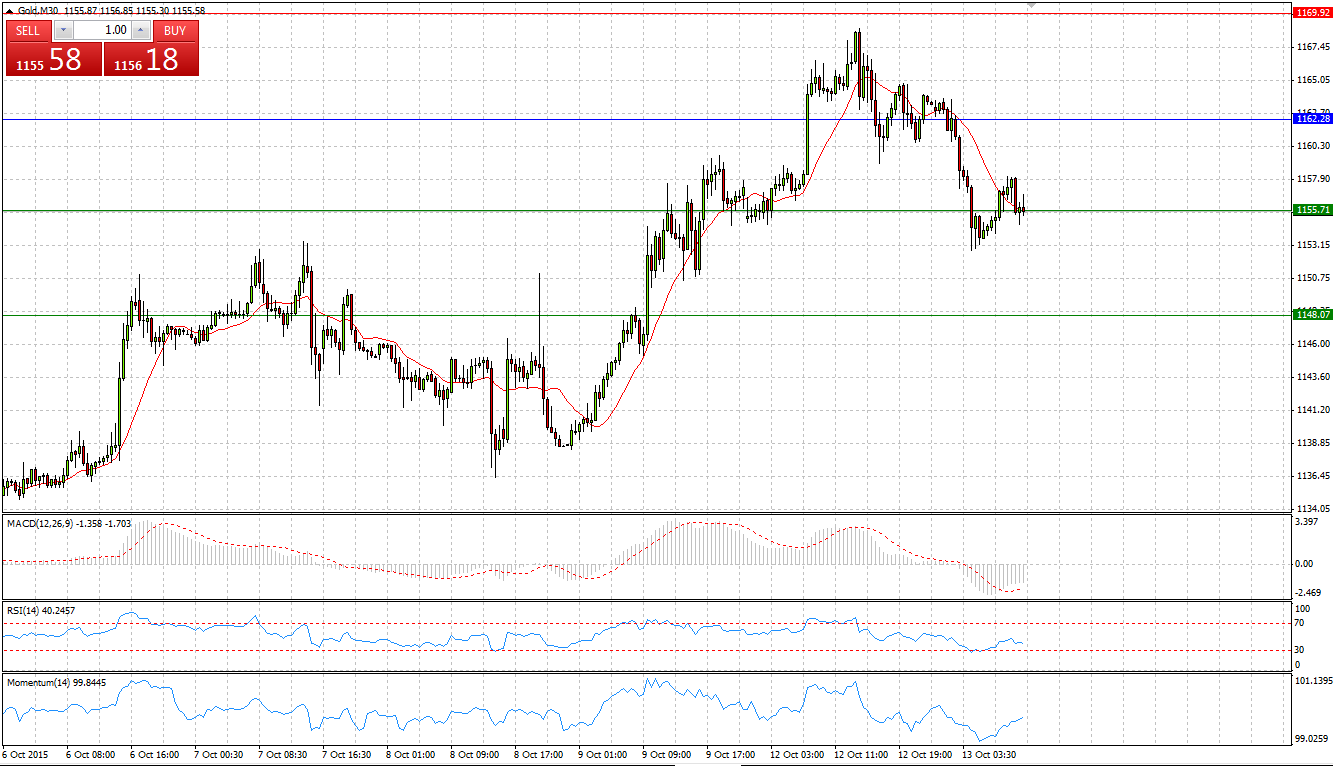
Market Scenario 1: Long positions above 1155.71 with targets at 1162.28 and 1169.92
Market Scenario 2: Short positions below 1155.71 with targets at 1148.07 and 1133.86
Comment: Having tested 24th of August highs, gold retreated to the first support level. However, another attempt might be undertaken later today.
Supports and Resistances:
R3 1190.70
R2 1176.49
R1 1169.92
PP 1162.28
S1 1155.71
S2 1148.07
S3 1133.86
CRUDE OIL
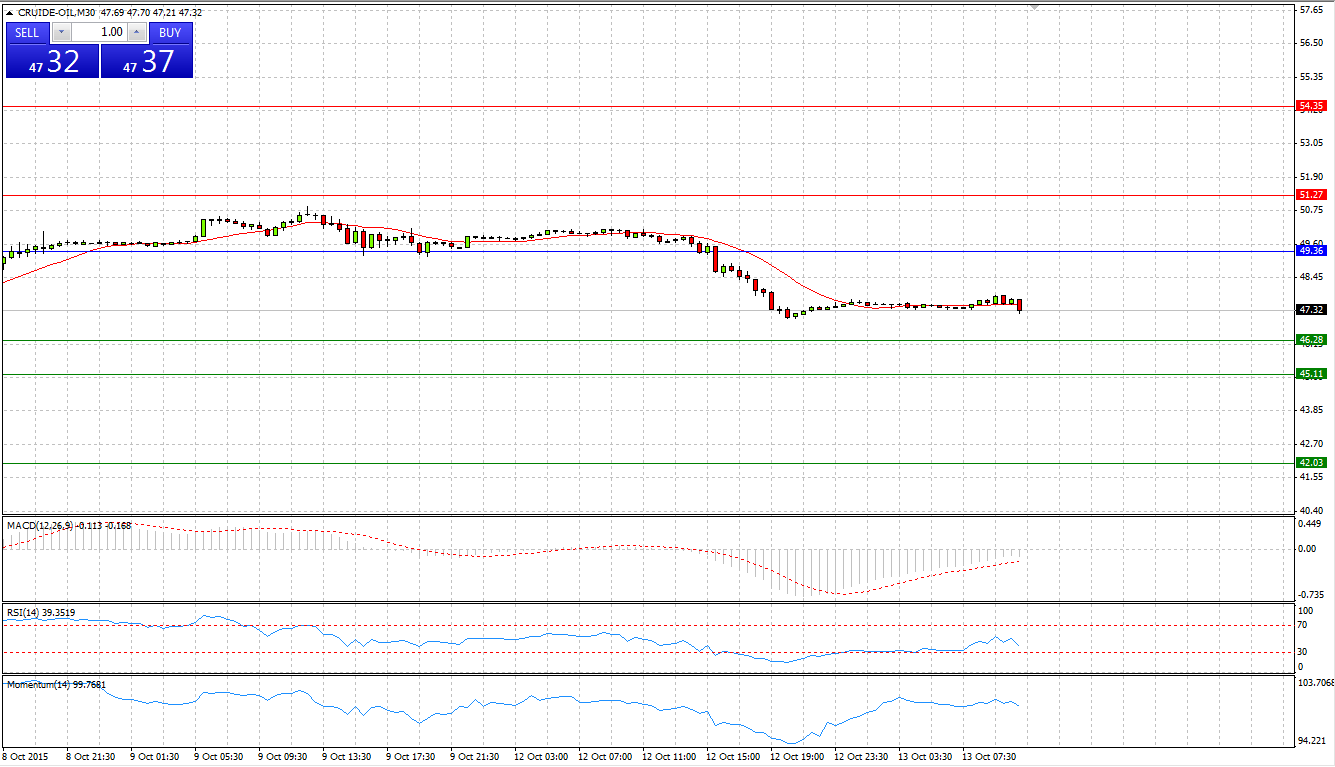
Market Scenario 1: Long positions above 48.19 with targets at 49.36 and 51.27
Market Scenario 2: Short positions below 48.19 with targets at 46.28 and 45.11
Comment: Crude didn’t manage to retain its position above 50 USD per barrel and was drastically sold off, giving up earlier gains. Crude is currently trading below Pivot Point level close to the first Support Level.
Supports and Resistances:
R3 54.35
R2 51.27
R1 49.36
PP 48.19
S1 46.28
S2 45.11
S3 42.03
Market Scenario 1: Long positions above 60.72 with targets at 61.75 and 62.56
Market Scenario 2: Short positions below 60.72 with targets at 59.90 and 58.87
Comment: Ruble depreciated against US dollar amid heavy sell off of crude oil. It appears that Friday’s late retracement in crude oil was in fact a sign that the bears are once again regaining control and further losses could lie ahead. Decrease in oil prices will have negative effect on ruble
Supports and Resistances:
R3 64.41
R2 62.56
R1 61.75
PP 60.72
S1 59.90
S2 58.87
S3 57.03
