On Wednesday the oil price advanced 3% due to the considerable weekly decrease in its stocks in the US with inventories at the Cushing delivery hub declining the most since February 2014. We assume the possibility of the further increase in the oil prices but suggest examining now the currency pair of the Russian ruble against the Japanese yen. Russia is one of the leading fossil fuels exporters, thus, its currency is strengthening given the growing global oil prices. On the contrary, Japan is importing almost the full range of energy products. Will the ruble continue strengthening against the yen?
Let’s mention another two considerable causes of the possible trend continuation. The scheduled president Putin’s visit to the 70th UN Assembly on September 28 contributes to the stronger ruble. The move may become the first step towards the normalization of relations between Russia and the Western countries. Yen, in its turn, is under pressure after the international agency Standard&Poor’s downgraded its long term rating from АА- to A+ which is four points lower the highest level of AAA. The Japan’s rating was revised down for the first time in January 2011 and since then the yen has lost about a third of its value. This happened due to the official commitment to the milder monetary policy or the so-called Abenomics. This very policy was criticized by the S&P agency which is not expecting the situation in the Japanese economy to improve in the coming 2-3 years. The remarkable thing is that Japan is the word leader by the public debt to the GDP ratio amounting to 226%. This is much higher than the Greek 177%.
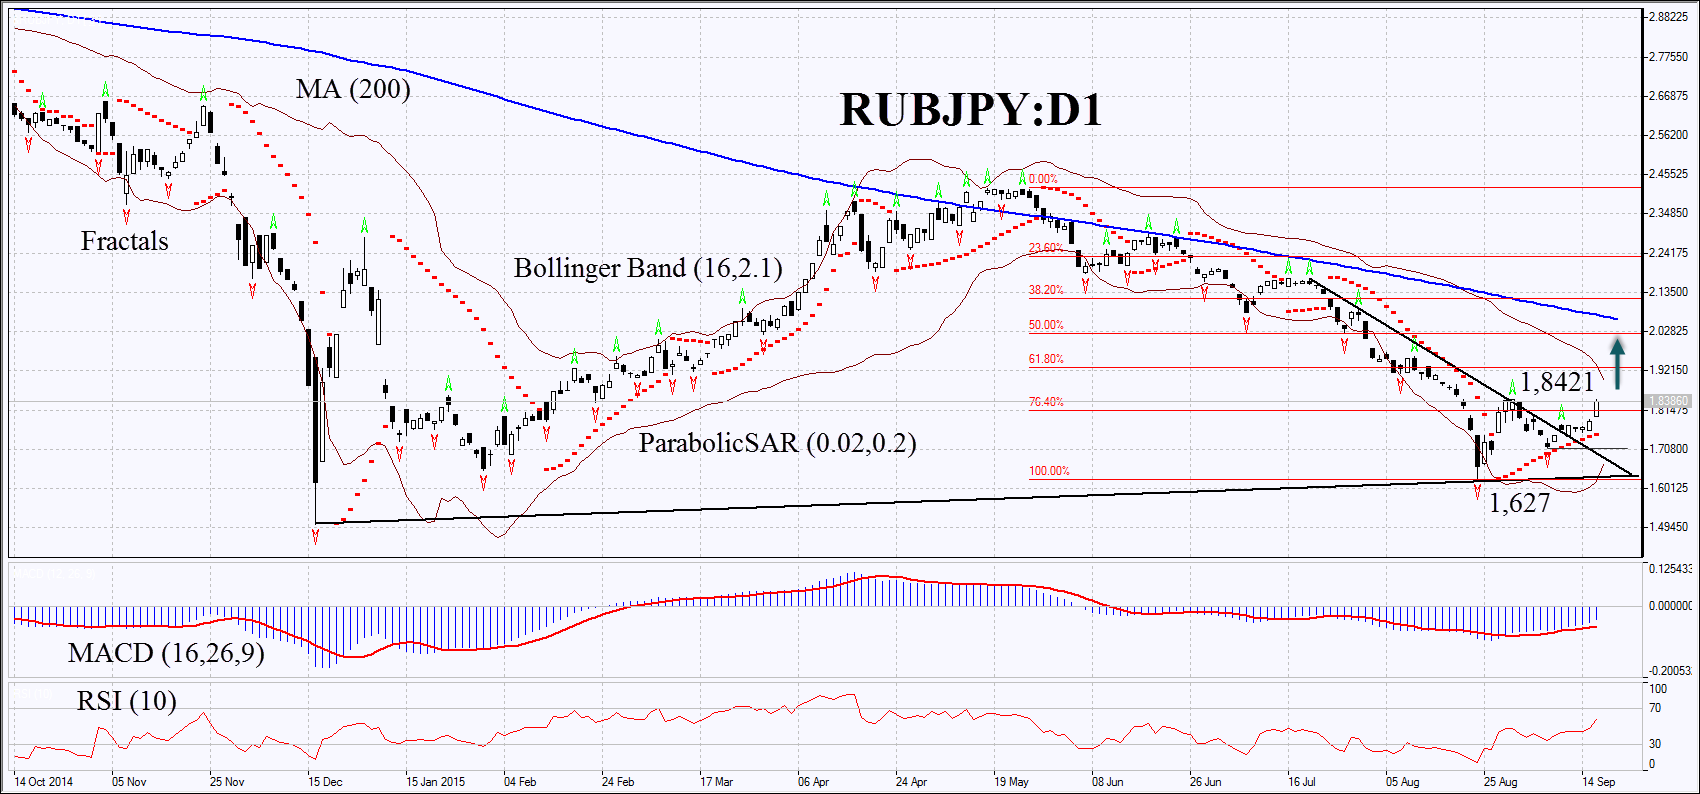
On the daily chart the RUB/JPY:D1 has surpassed the resistance of the mid-term downtrend. The MACD and Parabolic Indicators give the buy signals. The RSI has not yet reached the overbought level being above 50. The Bollinger Bands® have contracted severely which may mean the lower volatility. The bullish momentum is possible if the ruble/yen pair overcomes the upper fractal of 1.8421. This level may serve the point of entry. The preliminary risk limit is possible below the first lower fractal of 1.713 or the second of 1.627. Having opened the delayed order we shall move the stop to the next fractal low (long position) following the Parabolic and Bollinger signals every 4 hours. By doing this we adjust the potential profit/loss ratio in our favour. The most risk-averse traders may switch to the 4-hour chart after the trade and place there a stop-loss moving it in the direction of the trade. If the price meets the stop-loss level of 1.713 without reaching the order of 1.8421, we recommend cancelling the position: the market sustains internal changes which were not taken into account.
PositionBuyBuy stopabove 1,8421Stop lossbelow 1,713 or 1,627
