If you've been long shares of Apple Inc. (NASDAQ: AAPL) in recent months, you've got a lot to be thankful about this Thanksgiving.
Since the week of 10/13, when AAPL traded as low as $95.18, the stock is up nearly $25, having hit an all time high of $119.75 on 11/25. Yesterday, AAPL closed at $119, its highest daily close ever, and the company's market capitalization is now upwards of $700 billion USD.
This latest run up is a lot to digest, so in this analysis we'll attempt to take a bite out of AAPL and gauge where we've come from thus far and what may lie ahead.
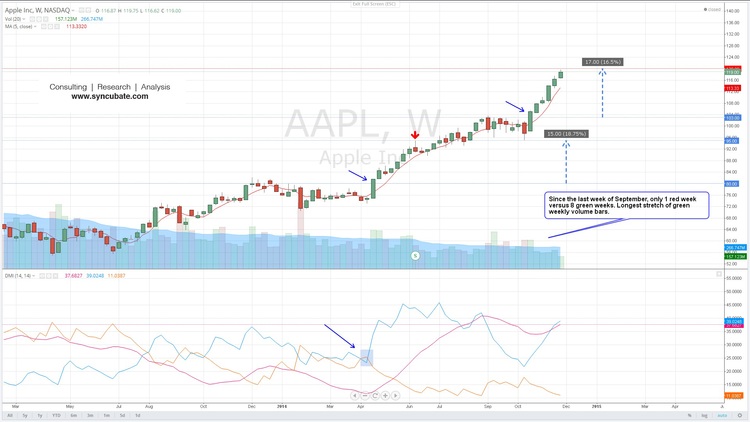
As we noted on 10/25, AAPL's most recent breakout was spurred by its first weekly close above $103, as pointed out on the chart above. This price level had been a considerable resistance area for the bulls going back to the end of August. Since the close above $103, the stock is up $17 a share, having advanced 16.5% in value in just over a month.
Similar price action occurred back in April, when AAPL bulls managed to close the stock above $80 on the weekly time frame to finish off the week of 4/21. After that feat, the stock continued to advance, rising to around $95 by the week of 6/9 before pulling back below its 5 week moving average in the weeks that followed.
Since the April spike above $80, AAPL bulls have been in predominant control of the price action on the weekly time frame, as +DMI remains above -DMI. Also, the ADX line has been rising throughout this span, so a trending move higher has been the overriding theme.
Conclusion
What distinguishes the run up since mid-October is the fact that it stands as the longest duration of consecutive green weeks for AAPL since the stock split in June. The last six weeks of trading have been positive, and of the last nine weeks, we have only witnessed one red week in which selling pressure from the bears exceeded buying interest from the bulls.
To put the uniqueness of this occurrence in perspective, the closest similarity we could trace goes back nearly three years. The run from the weeks of 1/23/12 to 2/27/12 was six consecutive green weeks that saw AAPL's share price rise from about $60 to around $78.
Currently, the 5 week moving average for AAPL rests at $113.33. Historically, the chart has shown us that the stock eventually does retrace to this level after sizable upside moves. For traders interested in assuming long positions, better entry points are likely in the near future. Chasing the stock higher is simply not prudent given the rate and extent of its rise thus far.

