
T2108 Status: 50.0%
VIX Status: 13.5%
General (Short-term) Trading Call: Hold (Aggressive traders can short with tight stops)
Active T2108 periods: Day #305 over 20% (includes day #280 at 20.01%), Day #19 over 40% (overperiod), Day #1 under 50% (underperiod – minus rounding), Day #4 under 60%, Day #45 under 70%
Commentary
First there was an ominous print that flagged the end of upward momentum. Next was a close call that demonstrated stubborn resilience again for the buyers. Today, September 9, 2014, the market has swung back into a danger zone. The red flags have brightened enough for me to give the (reluctant) go-ahead for aggressive shorts to stake their claims…with tight stops of course.
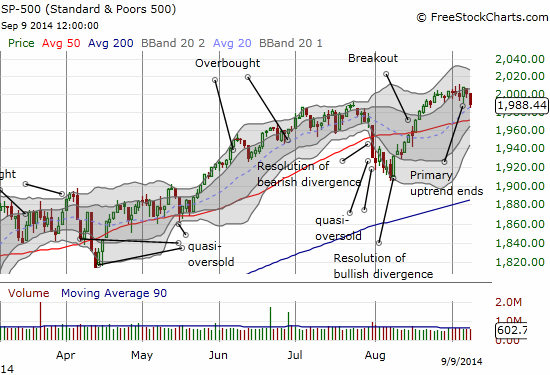
The S&P 500 takes an ominous downward turn as 20DMA gets tested for first time since breakout
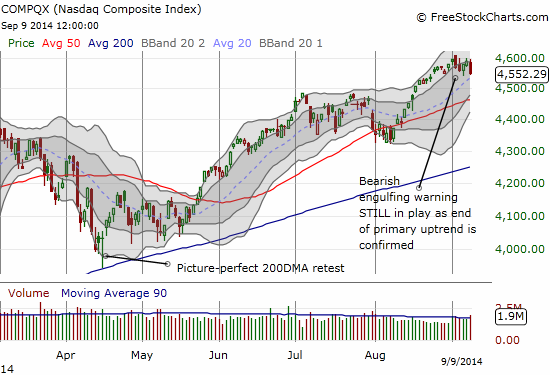
The NASDAQ’s primary uptrend officially comes to an end as bearish engulfing top remains in place
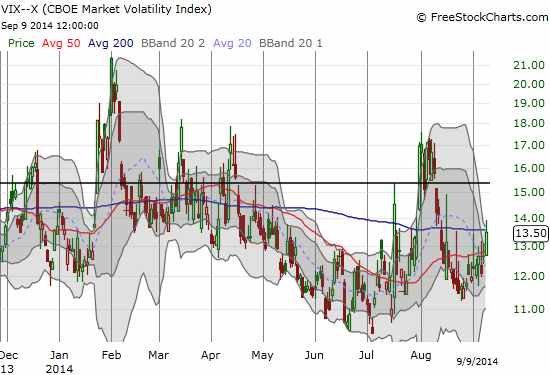
The VIX did not retest recent lows and is now positioned for a new run-up
The confirming part of these bearish signals is T2108. It closed a fraction under 50% for the first time in three weeks. Its large drop, 11.4%, confirms the end of its run-up and the divergence that I did not dare call bearish last week. T2108 is now leading the S&P 500 downward.
The currency market is providing some additional confirmation for me. Just as I pointed out that the last month of the U.S. dollar’s rally made little to no progress against high-yielding currencies, the U.S. dollar breaks out against the Turkish lira (USD/TRY), and, even more importantly, the Australian dollar breaks down against the U.S. dollar. Moreover, the Australian dollar’s run-up against the Japanese yen (AUD/JPY) has likely come to a definitive end.
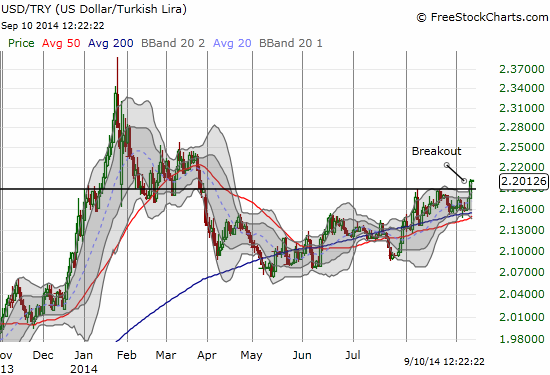
The US Dollar breaks out against the Turkish lira to a new 6-month high
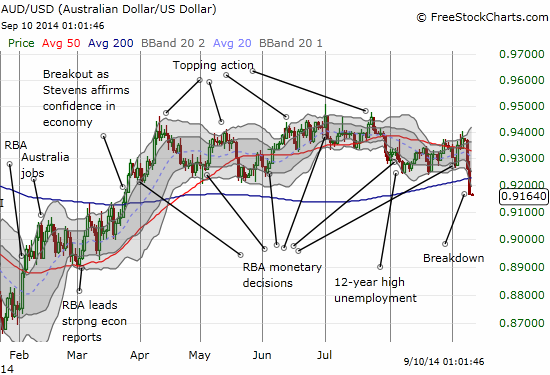
The Australian dollar FINALLY breaks down and confirms the topping action
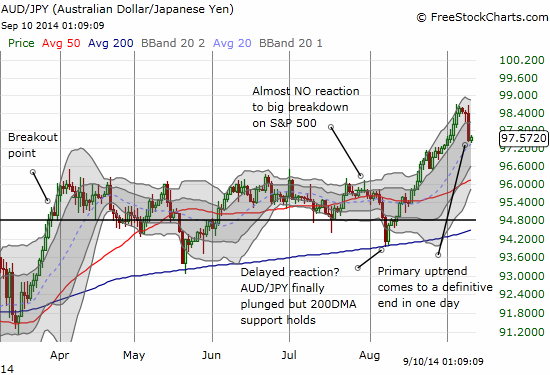
The Australian Dollar even manages a sharp reversal against the Japanese Yen which itself has considerably weakened against all major currencies over the past month or so
Regular readers know I have looked to the Australian dollar versus the Japanese yen for confirmation of bullish and bearish changes in the market. I see here a confirmation of a bearish change. While I am not yet comfortable taking a short position against the S&P 500 (SPY) here, I did rush to buy a hedged options position in iShares MSCI Emerging Markets (ARCA:EEM) with a heavy bias on put options. EEM has been surprisingly calm during the U.S. dollar’s run-up. It is still in an uptrend as defined by the 50DMA. However, the currency signals above and the increasing volatility in the currency markets in general tell me to expect greater odds of a significant pullback in EEM. The current pricing for EEM options suggests that the market thinks the relative calm will continue, so I like this trade even more since I can buy a potential pullback on the cheap.
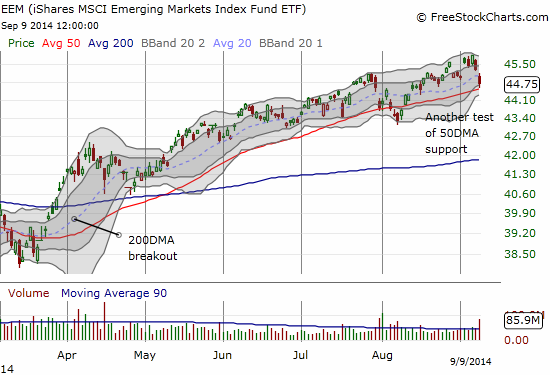
Can the relative calm persist for EEM?
To reiterate, the sentiment and momentum is slowly but surely swinging away from the bulls and buyers. The market is not outright bearish, but all the signs for caution are there. Aggressive traders can certainly feel a lot more comfortable going into short positions with well-defined stops. Look out in particular if the S&P 500 breaks through its 50DMA support again. Let’s also not forget that September is one of the most “dangerous” months of the year.
I must end this stock market update with another chart review of Apple (NASDAQ:AAPL). The company had its big product announcement today. Despite trading history that tells us NOT to buy into a product announcement, traders did it anyway. The end result was a very wild trading day with large swings in the stock that ultimately settled out into an effective stalemate above 50DMA support. I still think the big sell-off last week ahead of this announcement was ominous enough to take seriously the potential for a more sustained pullback in Apple’s stock. Only a trade to new all-time highs can erase that bearish signal.
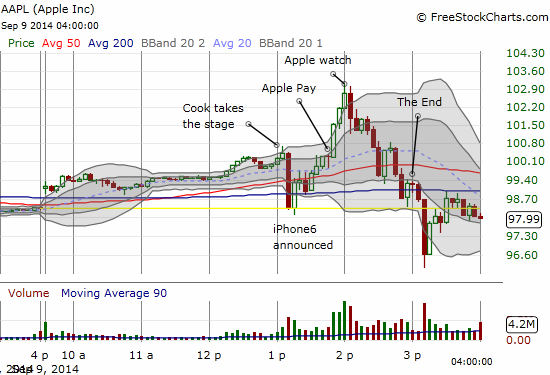
A wild ride from one announcement milestone to the next
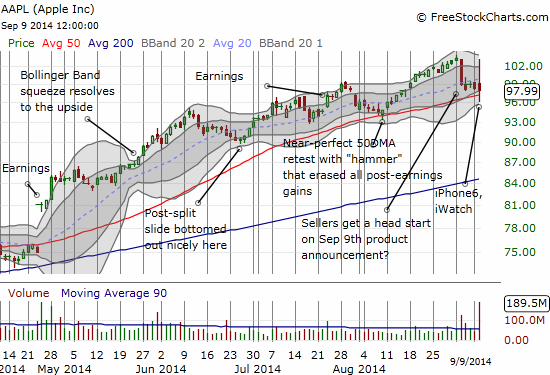
A stalemate, for now, just above 50DMA support
Of course, AAPL’s gyrations just as the NASDAQ (QQQ) is hitting a topping pattern makes the red flags shine all the brighter…
Daily T2108 vs the S&P 500

Black line: T2108 (measured on the right); Green line: S&P 500 (for comparative purposes)
Red line: T2108 Overbought (70%); Blue line: T2108 Oversold (20%)
Weekly T2108

Be careful out there!
Full disclosure: Long put and call options on EEM, net short Australian dollar, long USD/TRY