
T2108 Status: 43.9%
T2107 Status: 45.1%
VIX Status: 16.1
General (Short-term) Trading Call: Aggressive bears can open NEW shorts with tight stops; hold long positions and/or buy on dips. Watch resistance levels at the 50DMA and support for the VIX.
Active T2108 periods: Day #6 over 20%, Day #4 over 30%, Day #1 over 40% (ending 29 days under 40%), Day #32 under 50%, Day #34 under 60%, Day #76 under 70%
Commentary
The revenge of the bulls continues as the bears are now pressed into proving their mettle at critical resistance from several 50-day moving averages (DMAs). On Thursday, the major indices faded from 50DMA resistance, but it proved to be a temporary setback. Now, conditions seem aligned for a major breakout.
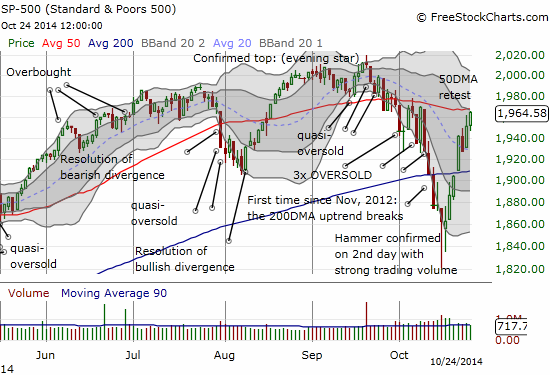
The S&P 500 makes a second visit to 50DMA resistance with a strong close at the day’s high
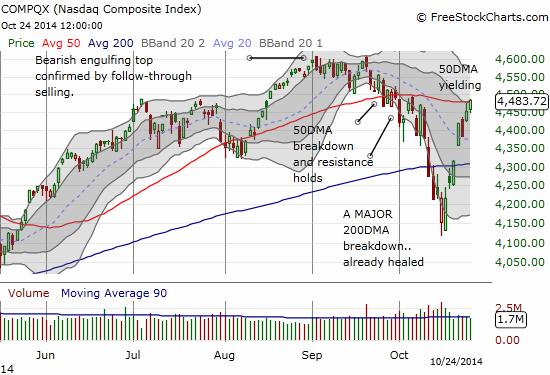
The NASDAQ is already pushing through 50DMA resistance
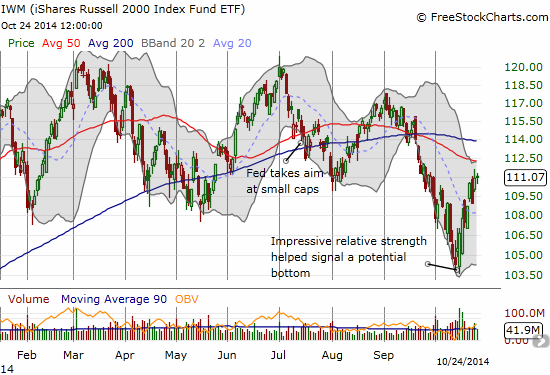
Small caps gave the recent bottom some flare, but are a little behind on a test of 50DMA resistance
These bounces have been very sharp and are begging for some kind of rest and pullback. On the other hand, the frantic buying can be considered the simple mirror image of the panicked, sharp selling that preceded it. From what I have casually seen in tweets and headlines, it seems to me bears are still clinging with nostalgia to that panicked selling without considering the possibility that the selling was the abnormal trading and not the current buying. After all, the selling included three oversold periods in rapid succession, T2108 falling as low as 13%, and T2107 (percentage of stocks trading above their 200DMA) falling as low as 25% which was a four-year low. THAT kind of selling will shake out a LOT of weak hands…and fool a lot of bears to over-pursue their prey.
T2108 is now at 43.9%, a very “comfortable” level. I now need to take a look at how long it might take for T2108 to return to overbought conditions. T2108 has traded below the overbought level, 70%, for 76 days. This is an extra-long time that has been prolonged by the “near miss” of overbought levels on the bounce from August lows. The chart below shows that the bulk of 70% underperiods end in about 50 trading days. The projected performance for the S&P 500 during this underperiod is essentially flat unless this underperiod turns into a historically long one. A flat performance produces a projection of the S&P 500 to return to 1985 where it sat at the end of the last overbought period (early July). This serves as a short-term upside target that is only 1% higher from current levels. This means that going forward in the short-term, bulls are much better served buying dips than chasing upside (from a risk/reward standpoint). I will save any further prognostication until the next overbought period actually starts. For example, if it happens BEFORE a fresh all-time high on the S&P 500, I might have to flip (short-term) bearish.
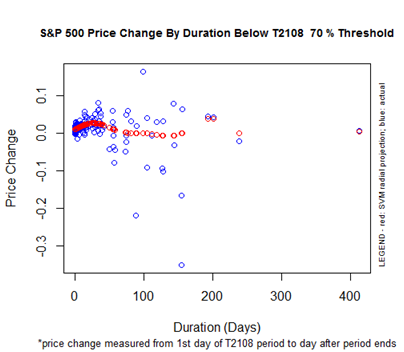
S&P 500 Price Change By Duration Below the T2108 70% Threshold
The volatility index has been crushed since the last flare-up, but it has stopped going down over the last 3 trading days.
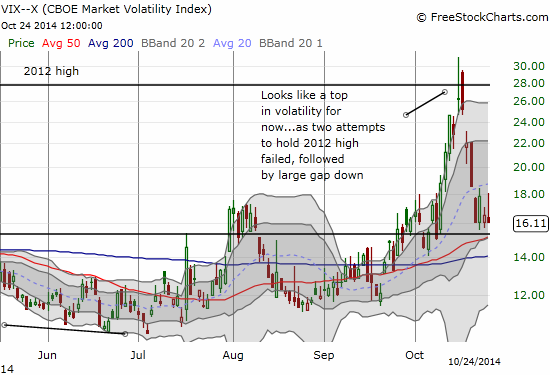
Is volatility reaching support?
I do not think I can consider the latest up-cycle in volatility to be over until/unless the VIX cracks below 14 or so. The VIX hovering over support presents one glimmer of hope for bears and acts as another counterpoint to my expectation for a major breakout above 50DMA resistance levels.
While we wait for the outcome of the 50DMA tests, here are some interesting chart reviews.
Netflix (NASDAQ:NFLX) has had an impressive rebound from its post-earnings angst in what has become an excellent relief rally. I laid out the case for the trade a week ago. With the indices testing resistance and NFLX’s upward momentum waning a bit, I went ahead and locked in the profits on my call spread…well ahead of the time I thought I would have to wait for this trade to play out. I think NFLX goes back to being a short if it pulls back and closes below the lows of the previous two days.
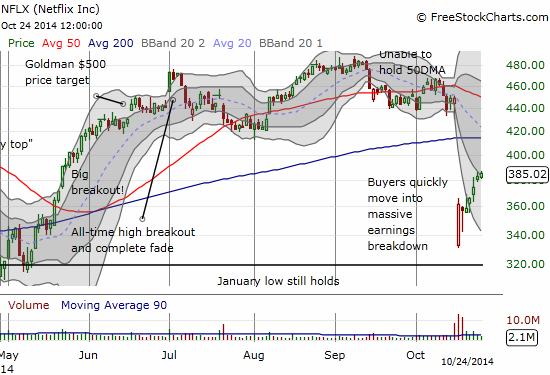
NFLX has had a sharp rebound from post-earnings angst. Is momentum running out now?
Intercept Pharmaceuticals, Inc. (NASDAQ:ICPT) is a trade I outlined way back in August. Credit to the buyers who kept this one aloft longer than I expected, but the building pressure of follow-through selling was just too much. Like many stocks, ICPT has benefited from the general stock market’s rebound. However, ICPT holders should not continue to count on that tailwind…
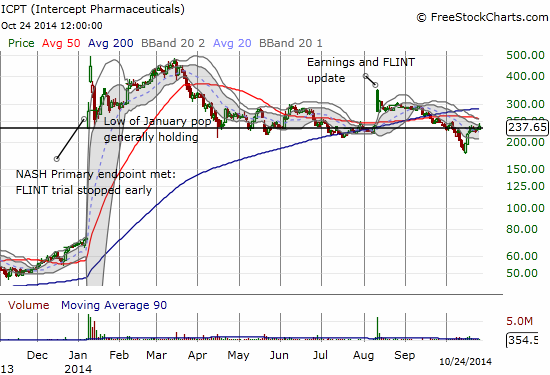
It took about a month, but ICPT followed through on August’s cap and crap
Citrix Systems, Inc. (NASDAQ:CTXS) is an example of how a breakdown fails to hold. It certainly caught me off-guard. I went after the stock with put options as the stock rallied from its lows and tagged the lower-Bollinger Bands® (BB). I was hoping to use it as a partial hedge on my overall bullishness. The very next day, the stock soared 2.8% to punch right through 200DMA resistance. And just like that, the stock looks like another good relief rally candidate to close the post-earnings gap down and even continue on up to the 50DMA.
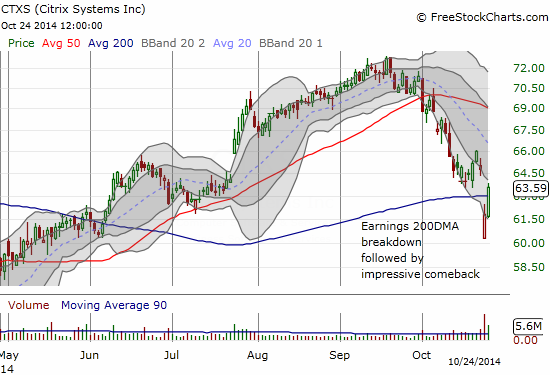
Citrix Systems Inc (NASDAQ:CTXS) has turned around an ominous post-earnings 200DMA breakdown into an impressive comeback
CSX Corp. (NYSE:CSX) is one of those “enough said” charts. Do NOT ignore the message of the transports! Even if in this case part of the lift is coming from M&A chatter.
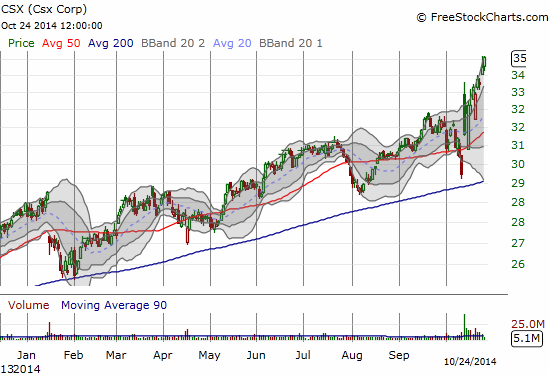
Hard to get too bearish with a railroad stock soaring to new all-time highs
I should have had airline stocks on my buy list during the oversold period. American Airlines Group Inc. (NASDAQ:AAL) has put on quite a show as it bounces from its depths. With airline stocks like AAL more than tripling since the end of 2012, I can certainly understand the eagerness to sell in the oversold period with a scare like Ebola in the headlines. But the selling completely ignored the incredible tailwind of plunging oil prices (the bulk of airline costs) AND the determination of the health community to contain and resolve the contagion.
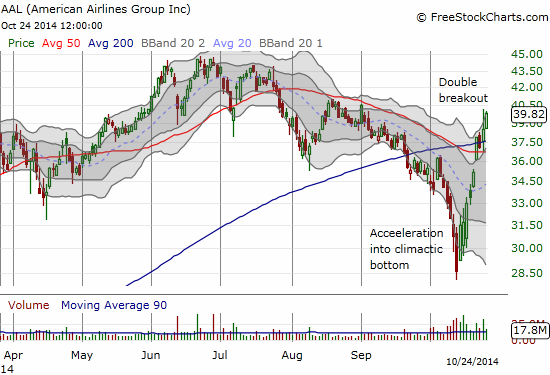
American Airlines bottomed 2 days ahead of the S&P 500 and is already up 39% from its low!
Daily T2108 vs the S&P 500")
Black line: T2108 (measured on the right); Green line: S&P 500 (for comparative purposes)
Red line: T2108 Overbought (70%); Blue line: T2108 Oversold (20%)

Be careful out there!
Full disclosure: Long SSO shares, long CTXS put options