
(T2108 measures the percentage of stocks trading above their respective 40-day moving averages [DMAs]. It helps to identify extremes in market sentiment that are likely to reverse. To learn more about it, see my T2108 Resource Page. You can follow real-time T2108 commentary on twitter using the #T2108 hashtag. T2108-related trades and other trades are occasionally posted on twitter using the #120trade hashtag. T2107 measures the percentage of stocks trading above their respective 200DMAs)
T2108 Status: 27.4%
T2107 Status: 20.2%
VIX Status: 20.9 (closed on 50DMA)
General (Short-term) Trading Call: Bullish (upside target of 1996 on the S&P 500 before overbought conditions finally occur again. See “From the Edge of A Breakout to the Ledge of A Breakdown” for more details).
Active T2108 periods: Day #1 over 20% (ends 4-day oversold period), Day #11 under 30% (underperiod), Day #33 under 40%, Day #93 under 50%, Day #110 under 60%, Day #315 under 70%
Commentary
In the last T2108 Update, I came as close as I could to predicting an end to the oversold period. Only the uncertainty of the jobs report prevented me from making the direct prediction. As it turned out, the oversold period indeed ended on Friday. However, the process unfolded in a VERY surprising way.
T2108 ended the day at 27.4%. T2108 started LOWER at 18.8% and sank from there as low as 16.2% as part of the fallout from the big miss on the jobs report. The selling ended almost as fast as it began. After about 40 minutes of consolidation, buyers took over for the rest of the day.
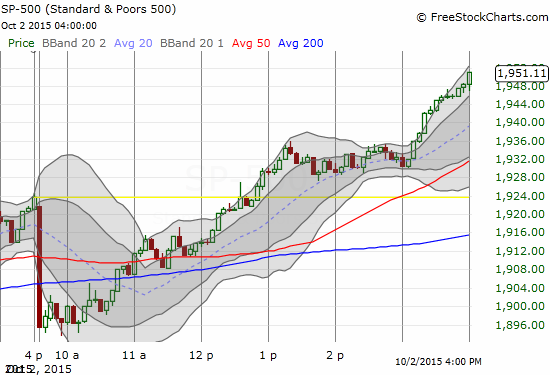
The S&P 500 (SPY) opened poorly in response to the jobs report but buyers quickly took over the trading action.

The end result was a VERY strong close that left Monday’s selling, and the start of the oversold period, behind in the dust.
I am not even going to try to explain the sudden change in heart by the market. I WILL note that this surge of buying that reversed Monday’s steep selling ends an important retest of August’s lows. If buyers can follow-through from here, the S&P 500 (SPY) may have laid the foundation for a double-bottom. Getting through October, the last of the seasonally weak months, without further losses or yet another test will firm up this foundation.
Fortunately, I treated the plunge like a fresh drop into oversold territory and loaded up on a new tranche of call options on ProShares Ultra S&P500 (NYSE:SSO). I was taken aback when I reviewed the position later in the day to find a 30% gain. I sold right away. At the close, I locked in my profits on the shares of ProShares Short VIX Short-Term Futures (SVXY) that I bought at the beginning of the oversold period. This 4-day oversold period delivered yet another validation of the T2108 trading strategy. This time worked even better than the earlier two because it was a more typical run with a duration of 4 days.
The volatility index lost 7.1% on its way to a rest on its 50DMA. If the market pushes further away from oversold conditions, volatility could very quickly complete the reversal of the angst that erupted in Augst.
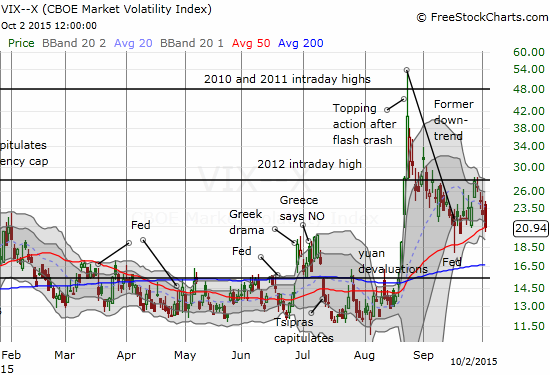
The volatility index is under pressure again.
The U.S. dollar index also experienced a sharp reversal, but it continues to struggle with resistance at its 50DMA. A downtrend is looming overhead as well.
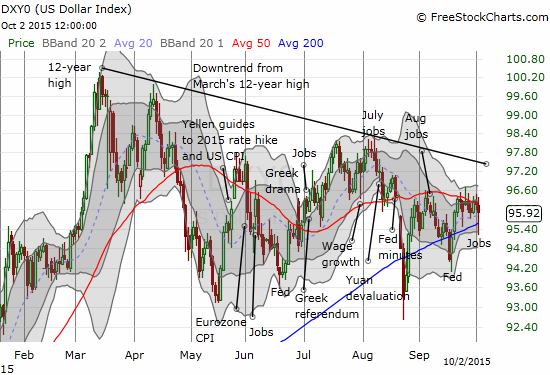
The U.S. dollar index has essentially gone nowhere for almost all of 2015. The downtrend from the 12-year high set in March looms larger and larger now.
The dramatic bookends for the week – huge down day on Monday and huge reversal on Friday – helped to generate some very dramatic moves in individual stocks. I review a small sample below…
The iShares MSCI Emerging Markets (EEM) gained 2.7% on the day and surged toward its 50DMA resistance again. My strangle play – out of the money call and put options – is now profitable on the call side. Ironically, this latest round would have been the first time in a very long time where I could have profited from BOTH sides of the trade.
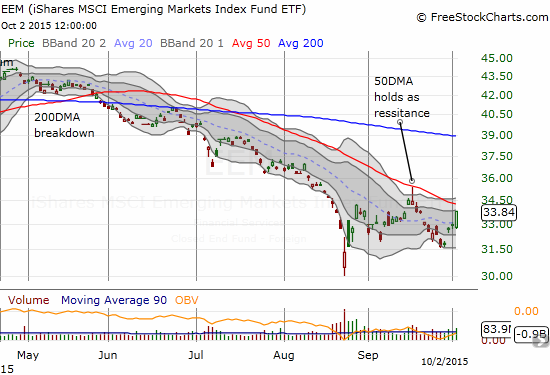
iShares MSCI Emerging Markets (EEM) surges toward 50DMA resistance.
Buyers remain active on the iShares Nasdaq Biotechnology ETF (IBB) as a bottoming process looks more and more likely now. Gilead Sciences Inc. (NASDAQ:GILD) reversed its big gap down but could barely close flat for the day. I am looking at GILD as a good “catch-up” play. (I have now written several posts following the drama on IBB since the Clinton Bash).
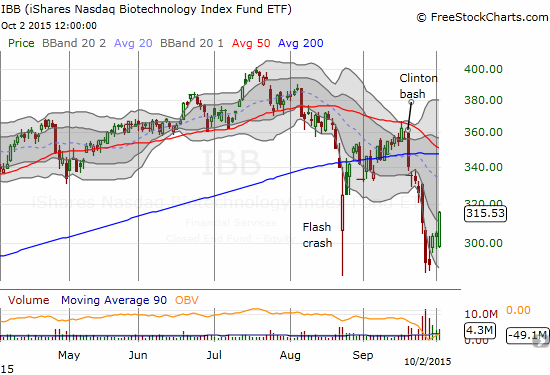
Buyers on the iShares Nasdaq Biotechnology ETF (IBB) print a very strong follow-through with a 3.5% gain on high volume.
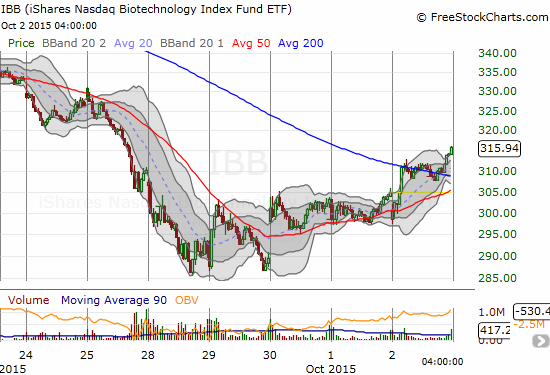
The 15-minute chart on IBB shows the return of momentum for buyers. Monday’s selling increasingly looks like final washout of panic.
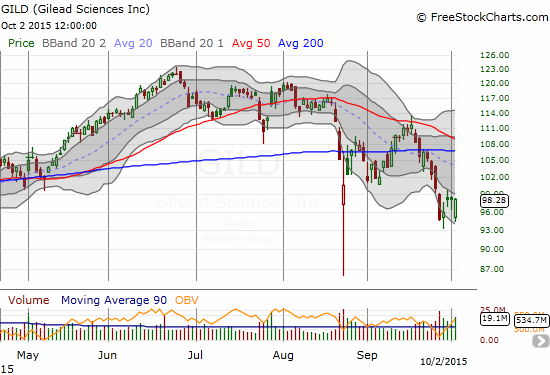
Gilead Sciences Inc. (GILD) gapped down and struggled just to close even on the day. It now lags the IBB recovery and looks like a good “catch-up” play.
On the week, Solar City (SCTY) went from its lowest close since the Flash Crash – and a 2-year low – to a close above the pivot I pointed out in late August. Resistance still looms overhead with the 50DMA.
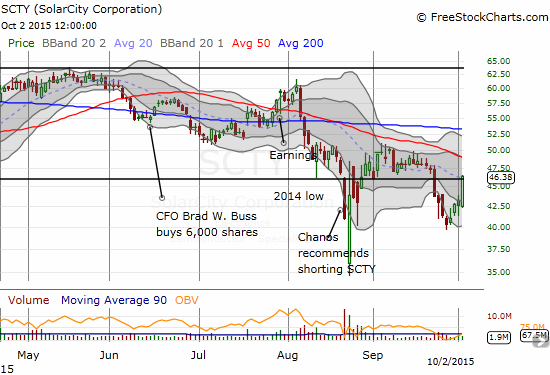
Solar City (SCTY) recovers from another severe bout of selling but now needs to beat overhead resistance.
SanDisk (NASDAQ:SNDK) is a GREAT example of the importance of closing out short positions during oversold conditions. I played SNDK puts off a retest of 50DMA resistance in mid-September. I locked in profits on Monday. I was also motivated by the push of SNDK below its lower-Bollinger Band (BB).
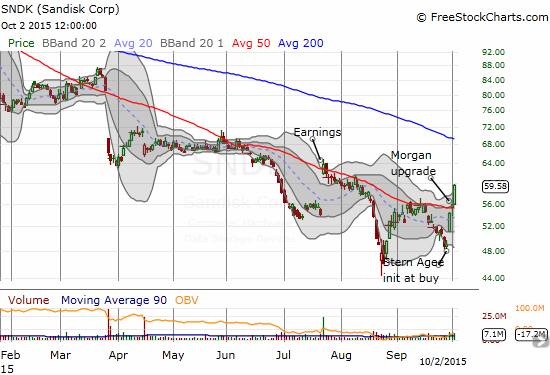
Sandisk (SNDK) is looking more bullish than it has looked in a very long time. Buyers step up bigtime.
Whole Foods Market (NASDAQ:WFM) made a classic “oversold” move by surging 8.5% on the mere rumor of merger and acquisition activity. This looks like a bottoming move given the surge off a retest of the intraday low in August. However, there is a LOT of damage to repair in WFM after two post-earnings down gaps and a steep downtrend this year.
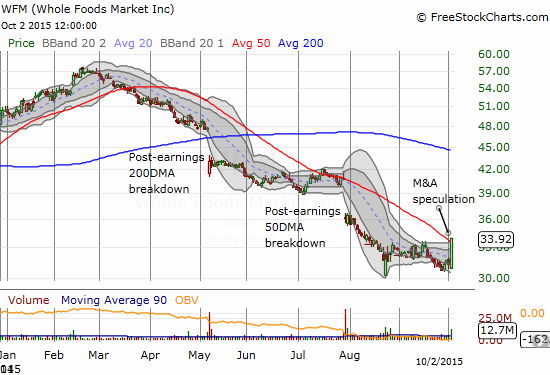
Whole Foods Market (WFM) shows a major sign of life.
Speaking of a major oversold market move, Wynn Resorts Ltd. (WYNN) soared an incredible 23% after rumors of corporate welfare on the way from the Chinese government to prop up casinos in Macau. I can understand trying to prop up productive activities, but propping up a gambling industry? Something tells me some heavy politicking is at work on that one. I decided to fade this move with put options. Let’s see whether the rumors prove to be false in the first place. If TRUE, clearly, there could be a LOT of upside left.
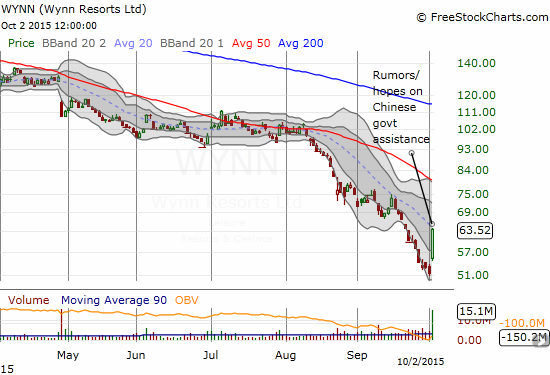
Wynn Resorts Ltd. (WYNN) erases seven trading days of losses in a hurry.
Now for some balance: the news was not ALL good. My long-term call options on Crocs, Inc. (CROX) are pretty much toast. An earnings warning from CROX took the stock down bigtime including some serious follow-through selling.
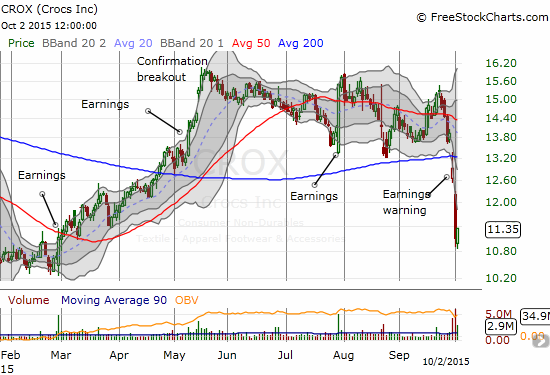
Crocs (CROX) is once again negative for 2015
Daily T2108 vs the S&P 500")
Black line: T2108 (measured on the right); Green line: S&P 500 (for comparative purposes)
Red line: T2108 Overbought (70%); Blue line: T2108 Oversold (20%)
Weekly T2108
Full disclosure: long SVXY shares, long SSO shares, long UVXY put options, long IBB call options, long AAPL put spread and puts, long GILD call options, long WFM call options