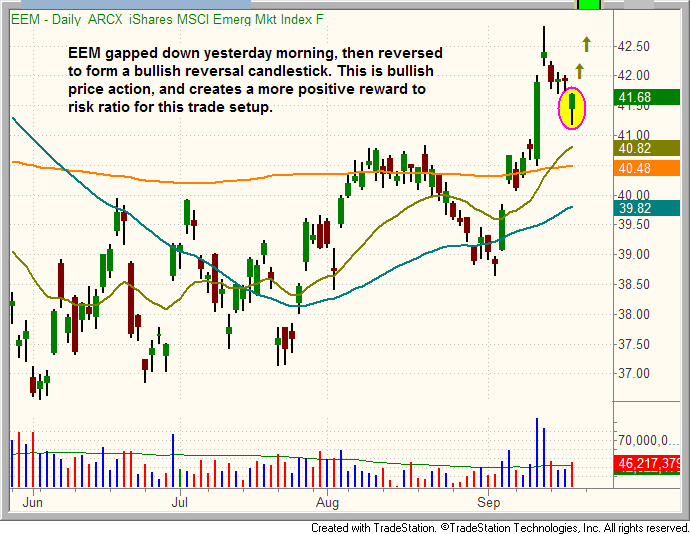
In Thursday’s Wagner Daily stock and ETF trading newsletter, we pointed out the potential trade setup in iShares Emerging Markets Index (EEM). Although listed on our watchlist, the trade did not hit our trigger price for buy entry. However, yesterday’s price action in EEM now makes our reward to risk ratio even more favorable for buy entry because the ETF gapped lower on the open, then reversed to close at its intraday high. This resulted in the formation of a bullish reversal candlestick, which is shown on the daily chart below:
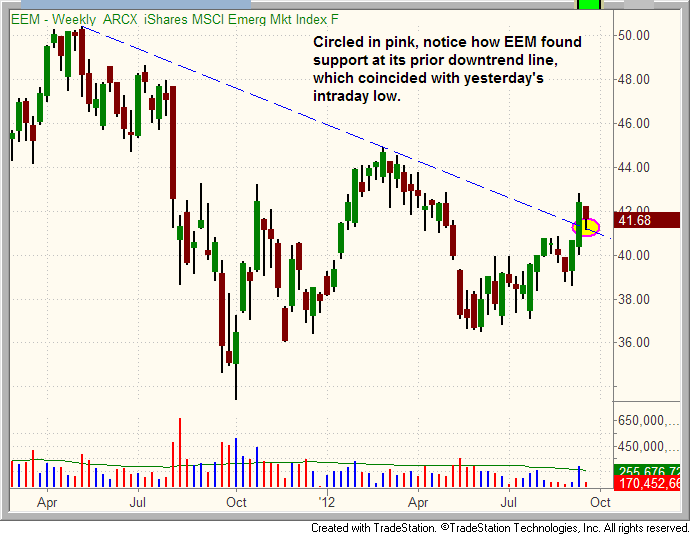
Looking at the weekly chart again, notice that Thursday’s pullback also caused EEM to come into new support of its prior downtrend line from the 2011 high. One of the most basic tenets of technical analysis is that a prior level of resistance becomes the new level of support, after the resistance is broken. Therefore, the prior downtrend line shown on the weekly chart below should provide substantial support for EEM:
When a stock or ETF is forming a bull flag chart pattern and then gaps down sharply, it has the effect of washing out the “weak hands” who sell a position that the first hint of trouble. This is positive because it absorbs overhead supply from traders who would otherwise be selling into the next move up. The end result is that it makes it easier for the stock or ETF to move higher when the buyers step back in. Then, traders who sold at the lows feel regret, which causes them to buy at a higher level, thereby adding to the bullish momentum. The other benefit of a stock that gaps down, but closes with a bullish reversal candlestick, is that it makes it easier for us to clearly define our stop price just below the low of the reversal bar. For these reasons, we now like the EEM trade even better. Subscribers should notice on the ETF Trading Watchlist that we have adjusted both the trigger and stop prices for the EEM swing trade setup.
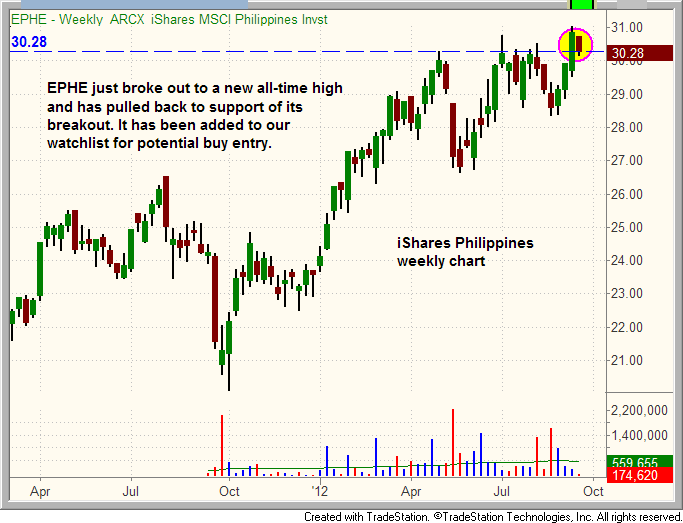
We also mentioned that several other international ETFs were starting to look good. One of those is iShares Philippines (EPHE), which just broke out to a new all-time high and has pulled back to new support of its breakout level. In addition to EEM, we have added EPHE to our watchlist for potential buy entry today. Subscribers should note our exact entry and exit prices for this setup. The weekly chart pattern of EPHE is shown below:
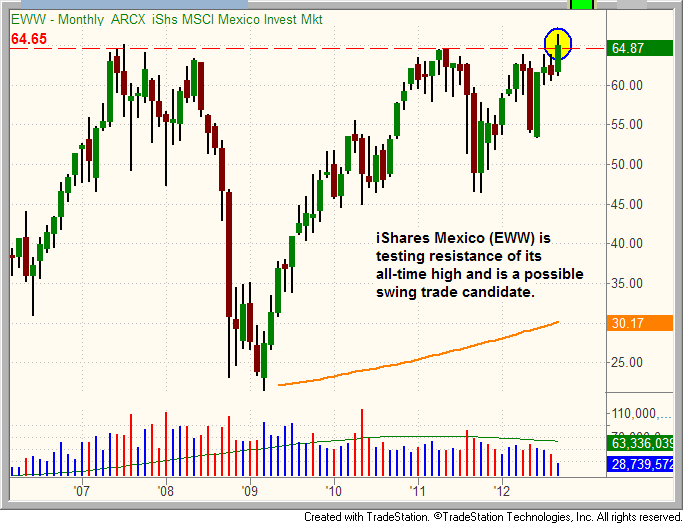
One other international ETF we are monitoring is iShares Mexico (EWW). It is not an “official” trade setup for entry yet, but it is definitely on our radar screen as a potential breakout candidate. The long-term monthly chart of EWW is shown below:
The other ETF that was on our watch list Thursday, Elements Intl. Agriculture (RJA), has yet to trigger for buy entry, but remains on our watch list going into Friday's market. Note the slightly adjusted trigger price. If it does not trigger, or at least forms a bullish reversal bar Friday, we will probably remove it from our ETF newsletter watchlist on Monday.
The commentary above is a shortened version of the September 21 issue of The Wagner Daily, our nightly stock and ETF trading newsletter since 2002. Subscribers to the this top-ranked ETF and stock picking service version receive our best ETF and stock swing trade picks with preset entry and exit prices, access to our proven trading strategy with market timing system, and access to our “turn key” technical stock screener software.
Original post
- English (UK)
- English (India)
- English (Canada)
- English (Australia)
- English (South Africa)
- English (Philippines)
- English (Nigeria)
- Deutsch
- Español (España)
- Español (México)
- Français
- Italiano
- Nederlands
- Português (Portugal)
- Polski
- Português (Brasil)
- Русский
- Türkçe
- العربية
- Ελληνικά
- Svenska
- Suomi
- עברית
- 日本語
- 한국어
- 简体中文
- 繁體中文
- Bahasa Indonesia
- Bahasa Melayu
- ไทย
- Tiếng Việt
- हिंदी
Swing Trading ETFs
Latest comments
Install Our App
Risk Disclosure: Trading in financial instruments and/or cryptocurrencies involves high risks including the risk of losing some, or all, of your investment amount, and may not be suitable for all investors. Prices of cryptocurrencies are extremely volatile and may be affected by external factors such as financial, regulatory or political events. Trading on margin increases the financial risks.
Before deciding to trade in financial instrument or cryptocurrencies you should be fully informed of the risks and costs associated with trading the financial markets, carefully consider your investment objectives, level of experience, and risk appetite, and seek professional advice where needed.
Fusion Media would like to remind you that the data contained in this website is not necessarily real-time nor accurate. The data and prices on the website are not necessarily provided by any market or exchange, but may be provided by market makers, and so prices may not be accurate and may differ from the actual price at any given market, meaning prices are indicative and not appropriate for trading purposes. Fusion Media and any provider of the data contained in this website will not accept liability for any loss or damage as a result of your trading, or your reliance on the information contained within this website.
It is prohibited to use, store, reproduce, display, modify, transmit or distribute the data contained in this website without the explicit prior written permission of Fusion Media and/or the data provider. All intellectual property rights are reserved by the providers and/or the exchange providing the data contained in this website.
Fusion Media may be compensated by the advertisers that appear on the website, based on your interaction with the advertisements or advertisers.
© 2007-2024 - Fusion Media Limited. All Rights Reserved.
