I keep getting peppered with queries about the rising volatility. Some want to link it to the FOMC meeting this week or the modest participation in the ECB's new TLTRO facility. However, the implied volatility picture is more complicated.
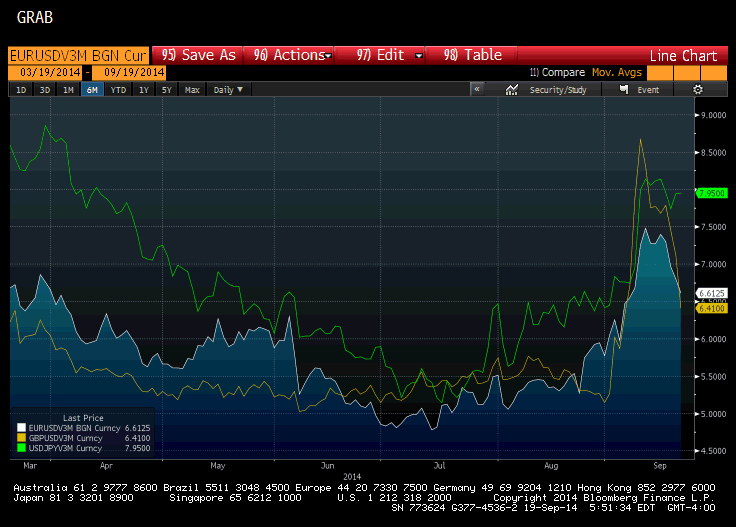
This Great Graphic, created on Bloomberg, shows the implied three-month volatility of the euro (white), sterling (yellow) and yen (green). Yen vol remains elevated, which makes sense given that the dollar continues to make new multiyear highs against the Japanese currency.
The real news is the drop not the increase in 3-month implied volatility for sterling and the euro, and that decline did not just take place today. Sterling vol peaked on September 10 near 8.8%. It finished near 7% yesterday and is now slipping through 6.4%. It is at its lowest level since Sept 4, and below its 20-day moving average for the first time since Sept 2.

Euro volatility has also pushed back. It peaked on Sept 11 just above 7.51%, and retested it on Sept 16. It is now offered below 6.63%. The 20-day average comes in near 6.58%. It has not been below this average since August 25.
We see three takeaways. First, implied currency volatility bottomed in mid-July. It does not line up well with the volatility in the VIX or bond market (MOVE). In fact, VIX is trading below its 100-day moving average (12.5%), having unwound the spike from late-July and early-August. MOVE, a estimate of bond market volatility, has moved higher after bottoming in early August. Earlier this week it was at its highest level since February. We note that it peaked on Tuesday just above 67 and was near 62 at yesterday's close. Treasury yields are a bit firmer today, suggesting vol may also firm.
Second, historical currency volatility is much lower than implied, and thee is not nearly as much divergence between the currencies. The three-month historical volatility is 5.02%, 5.17% and 5.27% for the euro, yen and sterling respectively.
Third, the foreign exchange market led (anticipated?) fundamental developments. The dollar broke out of its JPY101-JPY103 four-month trading range in late-August. The US-Japan 10-year spread was near the lows for the year at the end of August below 1.85%. Now its stands at 2.06%, which is the upper end of its four-month range. Sterling vol peaked couple of days after the YouGov poll showed the nationalists ahead in Scotland, despite the continued tightness of the opinion polls. Volatility still seems to be a function of market direction. Stocks rally, VIX comes off. Bonds sell-off (yields rise) and MOVE tends to increase. Sterling and euro consolidate losses, vol comes off. The dollar extends gains against the yen, vol firms.
