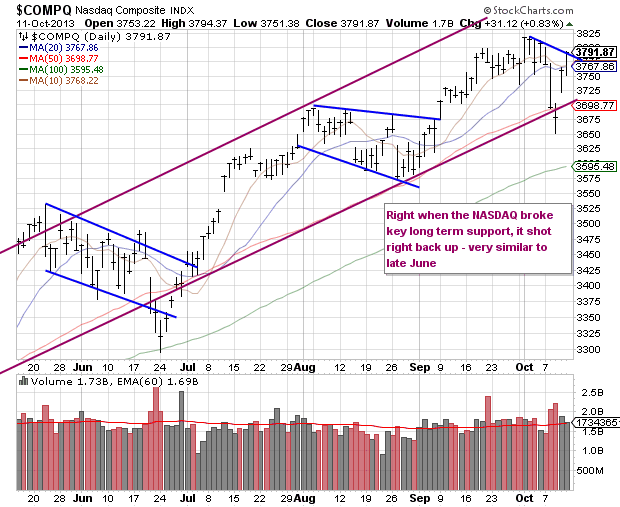
Stocks followed up Thursday's sharp reversal with a positive add on session. If the pattern of the past two corrections / rallies plays out, we'll see a period of 2-3 weeks of near vertical move up in the market with nearly no rest. That is not to say history has to repeat itself, but that has been the recent pattern. If so, today would only be day 2 of this vertical move. The S&P 500 gained 0.63% and the NASDAQ 0.83%. At this point most think there will be a budget deal soon that includes kicking the can down the road to January 2015 - so one big wrench in the spoke would be if that does not happen obviously. In economic data, the Thomson Reuters/University of Michigan index of consumer sentiment fell in October to its weakest in nine months and was below expectations.
The moves on the indexes are self apparent; it has been quite a week - at the close Tuesday the S&P 500 had already been down 2% for the week, but within 3 days it finished up 1% on the week.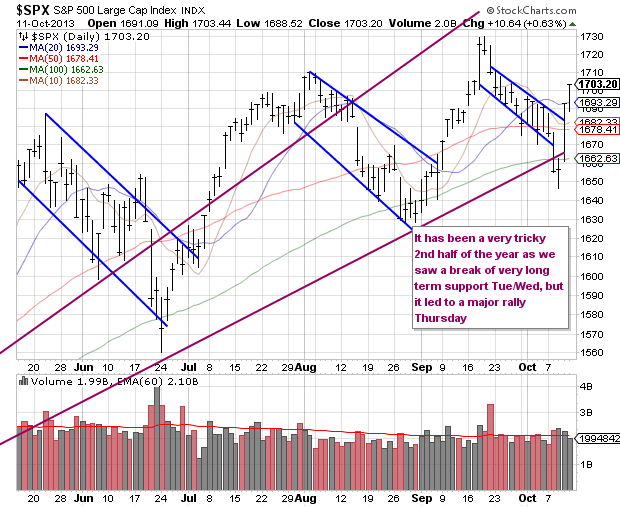
The volatility index continued to crumble, a positive for the bullish case.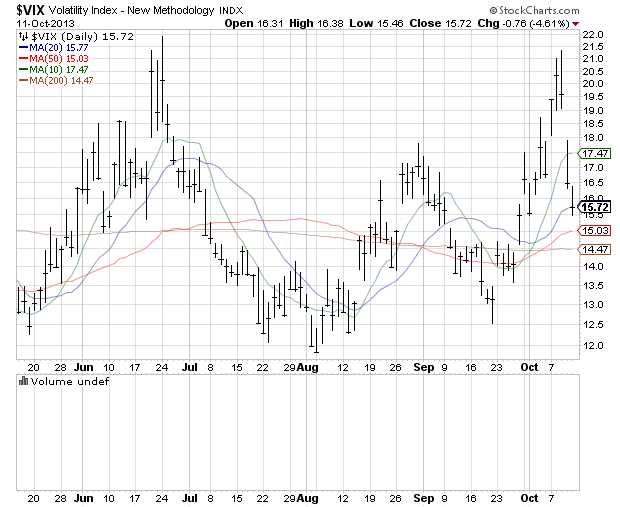
The NYSE McClellan Oscillator; at -60 mid week is now positive!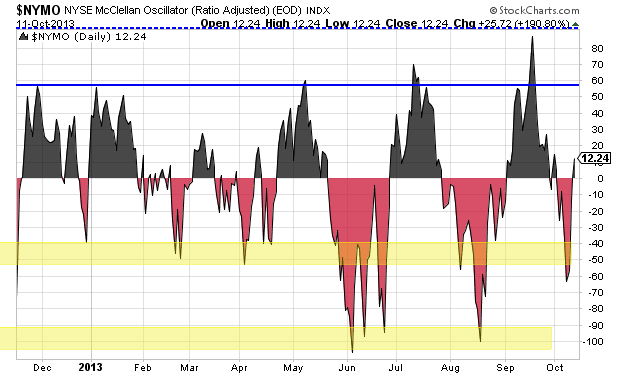
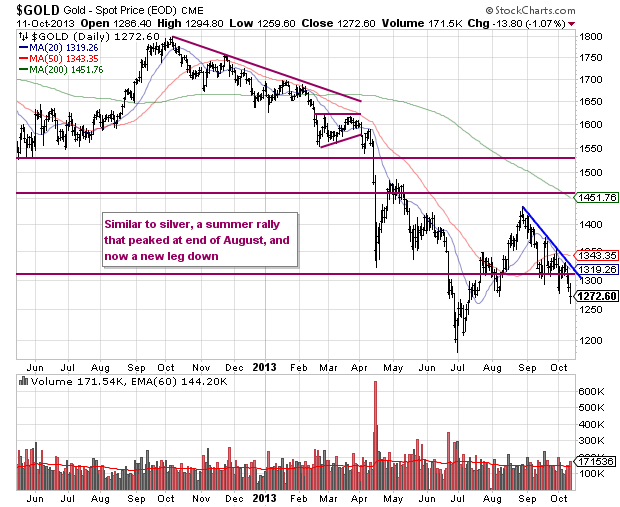
Gold and silver had rough weeks.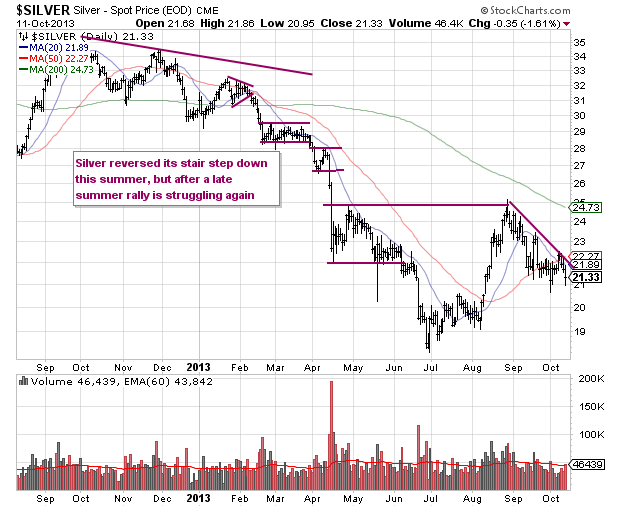
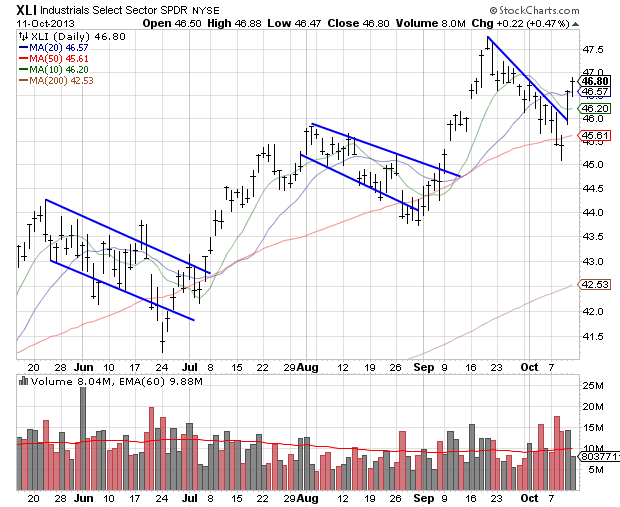
Looking at sectors the first groups to come out of this correction in the best shape appear to be industrials (XLI), technology (XLK), and energy (XLE). That is a quite positive group of sectors that would favor a 'pro-growth'/cyclical outlook.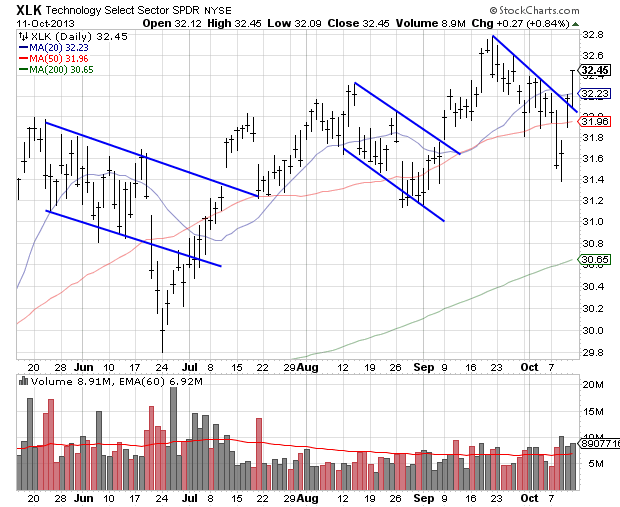
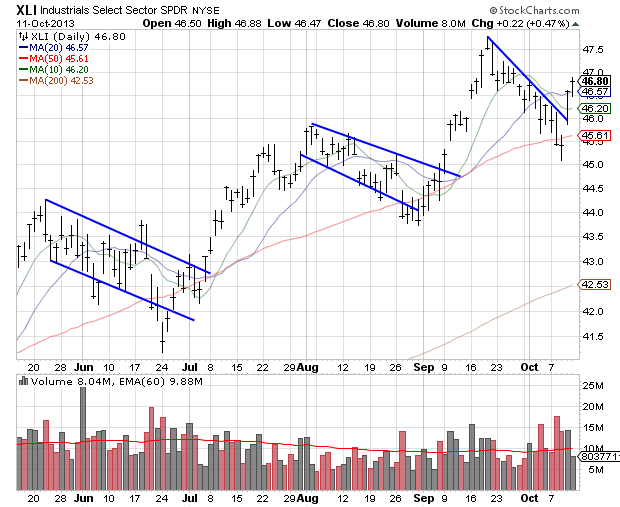
Keep in mind the heart of earnings season begins next week and a lot of big names will report in the coming 2 weeks.
An interesting story to highlight from CNBC that estimates using cash rather than plastic / electronic costs Americans about $1700 per family
But there is a cost to using cash, in both time and money, that's not always considered. Those costs include fees to use a check-cashing service, withdraw from a non-network ATM or access wages loaded onto a payroll card. A new study by Tufts University, The Cost of Cash in the United States, puts the price tag at $200 billion a year for consumers and businesses. The cost of cash is about $1,739 a year for the average family.
Original post
- English (UK)
- English (India)
- English (Canada)
- English (Australia)
- English (South Africa)
- English (Philippines)
- English (Nigeria)
- Deutsch
- Español (España)
- Español (México)
- Français
- Italiano
- Nederlands
- Português (Portugal)
- Polski
- Português (Brasil)
- Русский
- Türkçe
- العربية
- Ελληνικά
- Svenska
- Suomi
- עברית
- 日本語
- 한국어
- 简体中文
- 繁體中文
- Bahasa Indonesia
- Bahasa Melayu
- ไทย
- Tiếng Việt
- हिंदी
STTG Market Recap: A Steady Move Higher?
Published 10/11/2013, 03:53 PM
Updated 07/09/2023, 06:31 AM
STTG Market Recap: A Steady Move Higher?
3rd party Ad. Not an offer or recommendation by Investing.com. See disclosure here or
remove ads
.
Latest comments
Install Our App
Risk Disclosure: Trading in financial instruments and/or cryptocurrencies involves high risks including the risk of losing some, or all, of your investment amount, and may not be suitable for all investors. Prices of cryptocurrencies are extremely volatile and may be affected by external factors such as financial, regulatory or political events. Trading on margin increases the financial risks.
Before deciding to trade in financial instrument or cryptocurrencies you should be fully informed of the risks and costs associated with trading the financial markets, carefully consider your investment objectives, level of experience, and risk appetite, and seek professional advice where needed.
Fusion Media would like to remind you that the data contained in this website is not necessarily real-time nor accurate. The data and prices on the website are not necessarily provided by any market or exchange, but may be provided by market makers, and so prices may not be accurate and may differ from the actual price at any given market, meaning prices are indicative and not appropriate for trading purposes. Fusion Media and any provider of the data contained in this website will not accept liability for any loss or damage as a result of your trading, or your reliance on the information contained within this website.
It is prohibited to use, store, reproduce, display, modify, transmit or distribute the data contained in this website without the explicit prior written permission of Fusion Media and/or the data provider. All intellectual property rights are reserved by the providers and/or the exchange providing the data contained in this website.
Fusion Media may be compensated by the advertisers that appear on the website, based on your interaction with the advertisements or advertisers.
© 2007-2024 - Fusion Media Limited. All Rights Reserved.
