Upcoming US Events for Today:
- Motor Vehicle Sales for September will be released throughout the day. Total Vehicle Sales are expected to decline to 16.8M versus 17.5M previous.
- ADP Employment Report for September will be released at 8:30am. The market expects 200,000 versus 204,000 previous.
- PMI Manufacturing Index for September will be released at 9:45am. The market expects 58.0 versus 57.9 previous.
- ISM Manufacturing Index for September will be released at 10:00am. The market expects 58.0 versus 59.0 previous.
- Construction Spending for August will be released at 10:00am. The market expects a month-over-month increase of 0.5% versus an increase of 1.8% previous.
- Weekly Crude Inventories will be released at 10:30am.
Upcoming International Events for Today:
- German Manufacturing PMI for September will be released at 3:55am EST. The market expects 50.3 versus 51.4 previous.
- Euro-Zone Manufacturing PMI for September will be released at 4:00am EST. The market expects 50.5 versus 50.7 previous.
- Great Britain Manufacturing PMI for September will be released at 4:30am. The market expects 52.7 versus 52.5.
The Markets
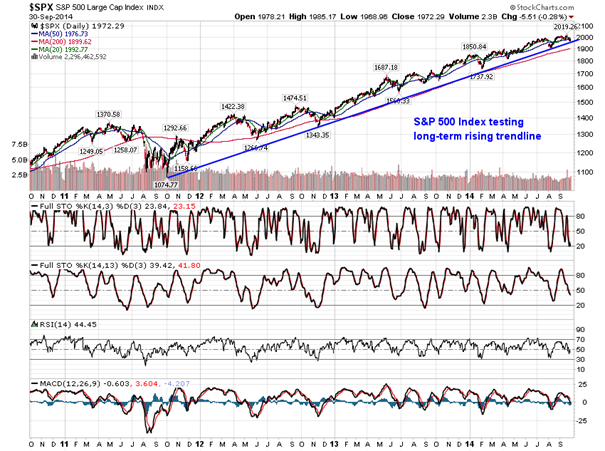
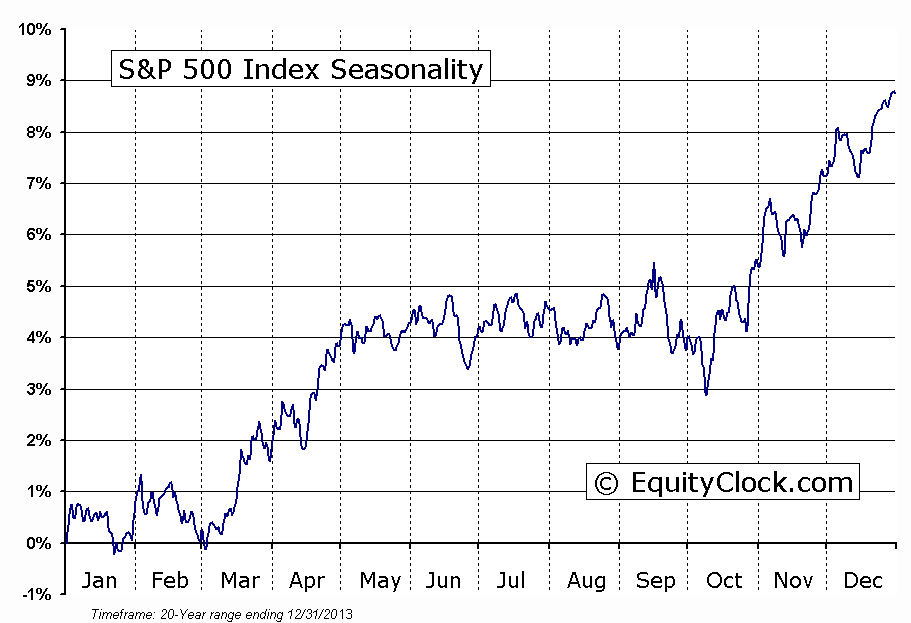
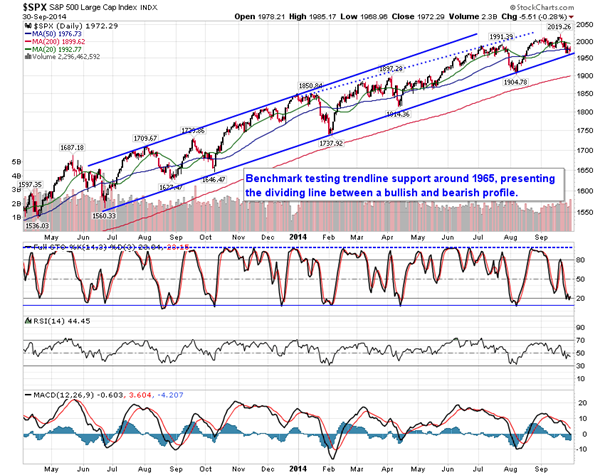
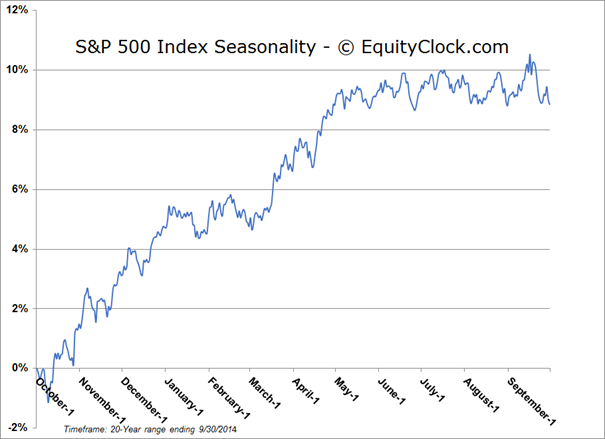
Stocks ended lower to finish the last trading day of September with theS&P 500 Index realizing a loss of 1.51% over the 30-day period. This is the second weakest monthly return of the year, rivalled only by the month of January in which the large cap index recorded a loss of 3.56%. Despite the monthly decline, the benchmark confirmed a gain on the quarter of 0.62%, the smallest gain in 7 consecutive quarters that the benchmark has maintained its present rising path. The benchmark is presently testing long-term trendline support as ongoing geopolitical concerns and speculation as to the timing of future monetary policy decisions weigh on stocks. Looking forward, stocks are about to enter the strongest quarter of the year. Over the past 20 years, the S&P 500 has gained an average of 4.90% with positive results realized in 75% of fourth quarter periods. Equity markets have typically been supported during this period by strength in consumer spending leading into the end of year holiday season, fuelling gains between now and New Year’s Eve. And despite its reputation for being a volatile month, October has averaged one of the strongest returns of the year over the past 20 periods. Average October gain over the past 20 years is 1.8% with positive results recorded in 65% of periods. Whether maintaining a rising trend or struggling under a falling trend coming into the fourth quarter, equity markets have historically found a tradable low during an approximately 4 to 6 week period surrounding the end of October, allowing traders to obtain an entry point for the period of seasonal strength ahead. At present, the seasonal low has yet to be revealed.

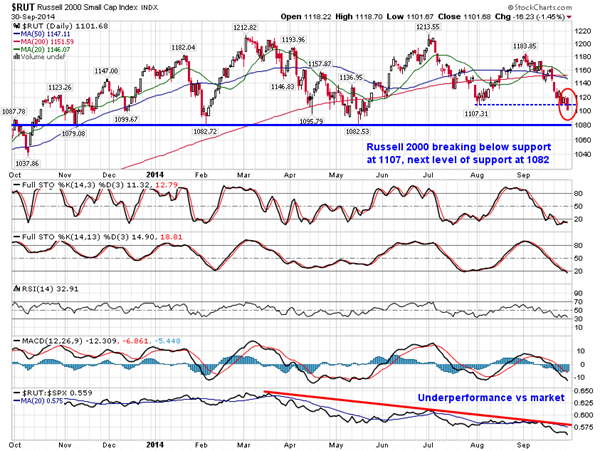
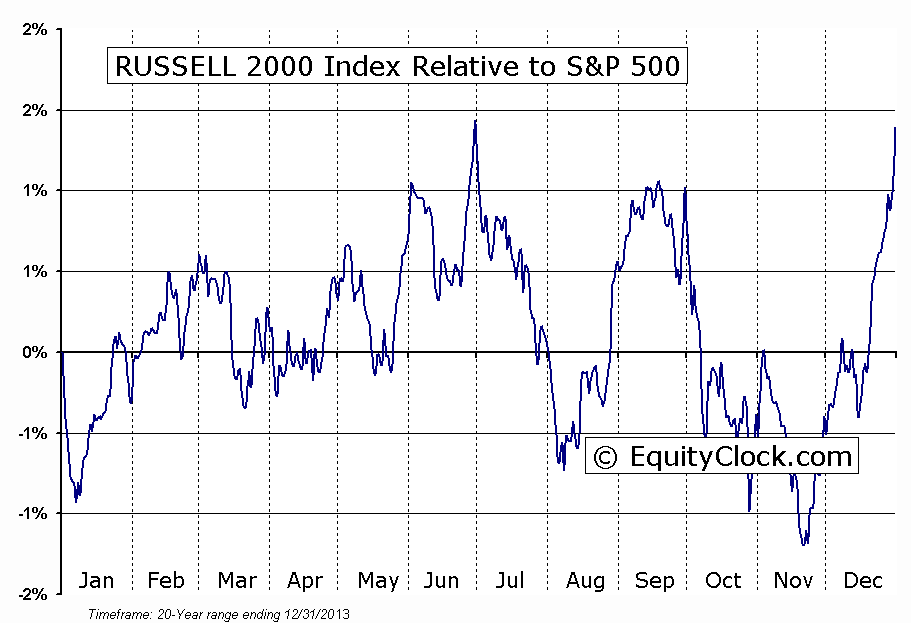
Until the period of seasonal strength can get underway, equity markets have to shake off overhanging uncertainties that are acting as a drag on upside momentum. The Russell 2000 Small Cap Index, typically a gauge of investors willingness to take on risk, broke below support at 1107 during Tuesday’s session, trading to the lowest level since May. Significant support is not far below at 1082, representing a drop of over 10% from the July high, which would place the benchmark firmly into correction territory. Small cap stocks have been underperforming the market for most of the year as investors anticipate higher borrowing rates ahead; stocks in this market segment have a greater difficulty absorbing this increased cost of conducting business. The Russell 2000 Index seasonally underperforms the S&P 500 through to mid-November.
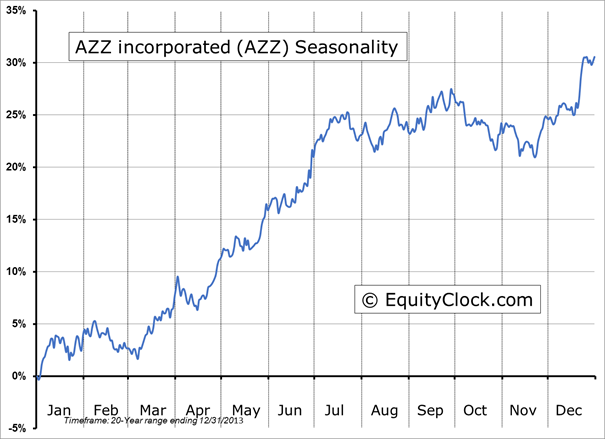
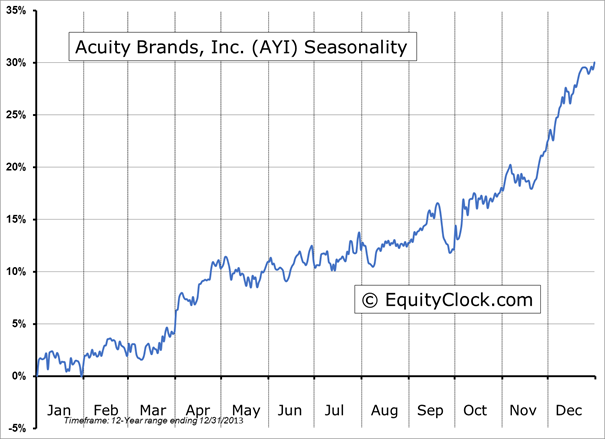
Seasonal charts of companies reporting earnings today:
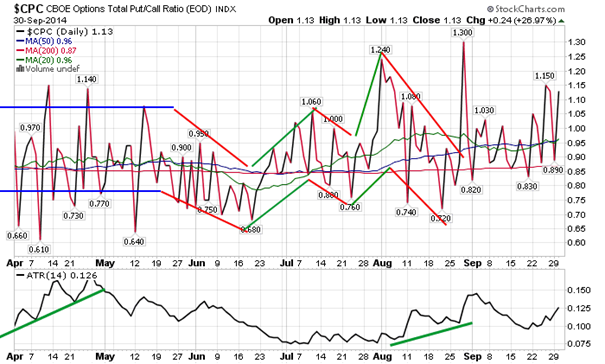
Sentiment on Tuesday, as gauged by the put-call ratio, ended bearish at 1.13. The Average True Range is once again starting to rise, indicating investor uncertainty as they rapidly jump between bullish and bearish allocations in order to position portfolios for the quarter ahead. Continued volatility/uncertainty eventually leads to declines in equity prices as investors give up hedging portfolios and look to just stand aside. Equity market volatility seasonally peaks during the month of October.
S&P 500 Index
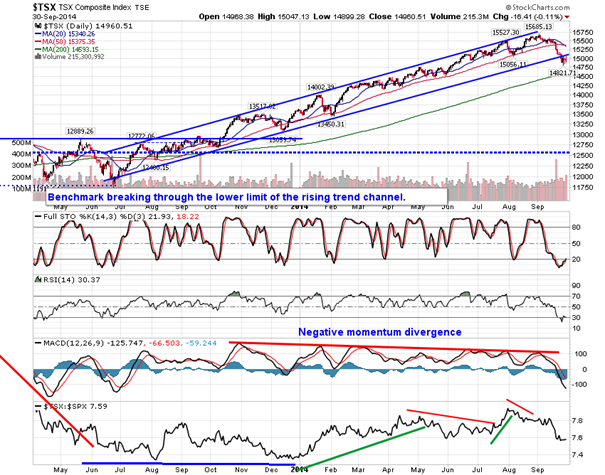
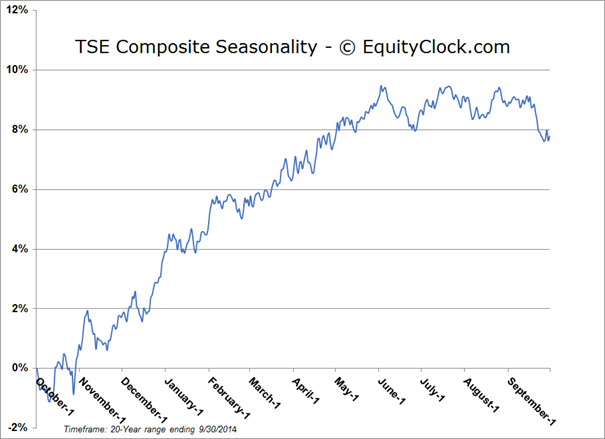
TSE Composite
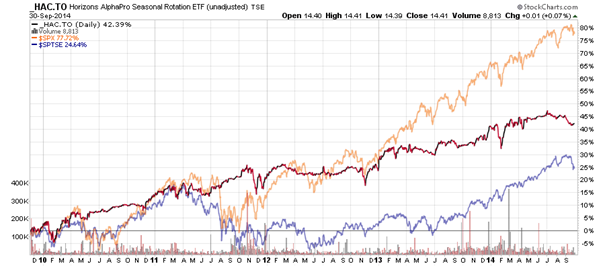
Horizons Seasonal Rotation ETF (TSX:HAC)
- Closing Market Value: $14.41 (up 0.07%)
- Closing NAV/Unit: $14.40 (up 0.05%)
Performance*
| 2014 Year-to-Date | Since Inception (Nov 19, 2009) | |
| HAC.TO | 0.70% | 44.0% |
* performance calculated on Closing NAV/Unit as provided by custodian

