Forex News and Events:
In an interesting turn of events this week, US housing market data has surprised to the upside. NAHB housing market index strength was quickly followed with heavy USD buying. Yesterday, housing starts which printed at 1093k verse 965 expected triggered the USD rally we are seeing today. What are generally two overlooked points of economic data, have seemed to generate significant FX volatility. The reason for this activity accelerating again, after a brief pause, was due to Fed Chair Yellen's justification of her dovishness on a weak housing market. In her semi-annual monetary policy report on July 15th, Yellen cautioned that a weak recovery in the US housing market was a risk to the broader economy. In her prepared remarks she warned, "the housing sector, however, has shown little recent progress. While this sector has recovered notably from its earlier trough, housing activity leveled off in the wake of last year's increase in mortgage rates, and readings this year have, overall, continued to be disappointing." Yellen's goal of keeping interest rates low is increasingly dependent on the interpretation of “slack” in the labor markets. Should housing activity continue to gain momentum it becomes hard to rationalize the Fed's ultra-accommodating monetary policy. We remain positive on the US housing recovery (upwards trend in building permits, new home sales, homebuilder confidences and pending home sales) and suspect that the Fed (select members) are overestimating the effect of benign wage growth on inflation. As the tight labor market begins to catch up we suspect that wage growth will rapidly increase, most likely catching the Fed flat-footed. Investors have already realize this and are actively responding to US data.
Short JPY favored
USDJPY is now approaching key resistance at 103.10. The decline in geopolitical risk premium, which has manifested itself in higher bond yields (U.S. 10-Year treasury yields off Friday 2.30% lows) and recovering equity markets should give USDJPY the pushing to break above this barrier. In addition, domestically Japan's economy is struggling highlighting by the unsettling GDP growth collapse of -6.8%. With falling inflation expectations Prime Minister Abe is increasingly likely to push the BoJ towards additional QQE (despite Economy Minister Akira Amari refusal to acknowledge the possibility) and a third economic stimulus package. And finally, changes to $1.26 trillion Government Pension Investment Fund (GPIF) board should allow allocation to shift ways from low-yielding Japanese government bonds to riskier assets including foreign investments. The reforms could have a pronounced effect on investment outflows further weakening JPY.
BoE Minutes
Today traders will be analyzing the BoE meeting minutes given the often confusion comments from BoE members in recent weeks. BoE Governor Carney’s press conference, sounding decidedly dovish and relaxed about the inflation outlook. Yesterday weaker-than-expected CPI read ( CPI y/y 1.6% and Core y/y 1.8%) suggests that his confidence might not have been misplaced. Despite the bank's degree of slack in the economy, numbers have been revised higher in its August Inflation Report and medium-term growth upwards & unemployment rate downwards. We are inching away from a November hike. Temporary factors like growing participation rate and Russian's ban of food imports from the EU should put downwards pressure on inflation and gives cautious Carney slightly more time.

Today's Key Issues (time in GMT):
2014-08-20T01:00:00 AUD Jul Skilled Vacancies MoM, last 1.60%2014-08-20T04:30:00 JPY Jun All Industry Activity Index MoM, exp -0.40%, last 0.60%
2014-08-20T07:00:00 JPY Jul Convenience Store Sales YoY, last -1.90%
2014-08-20T08:30:00 GBP Bank of England Releases Monetary Policy Meeting Minutes
2014-08-20T09:00:00 EUR Jun Construction Output MoM, last -1.50%
2014-08-20T09:00:00 EUR Jun Construction Output YoY, last 3.50%
2014-08-20T10:00:00 GBP Aug CBI Trends Total Orders, exp 4, last 2
2014-08-20T10:00:00 GBP Aug CBI Trends Selling Prices, last -4
2014-08-20T11:00:00 USD 15.août MBA Mortgage Applications, last -2.70%
2014-08-20T12:30:00 CAD Jun Wholesale Trade Sales MoM, exp 0.50%, last 2.20%
2014-08-20T18:00:00 USD Fed Releases Minutes from July 29-30 FOMC Meeting
The Risk Today:
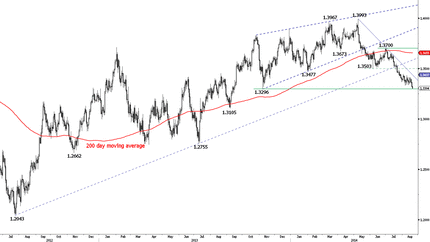
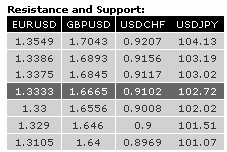
EURUSD has broken its support at 1.3333 and is now challenging the strong support at 1.3296. Hourly resistances for a short-term bounce can be found at 1.3336 (12/08/2014 low) and 1.3366 (intraday high). In the longer term, EUR/USD is in a succession of lower highs and lower lows since May 2014. The downside risk is given by 1.3210 (second leg lower after the rebound from 1.3503 to 1.3700). Strong supports stand at 1.3296 (07/11/2013 low) and 1.3105 (06/09/2013 low). A key resistance lies at 1.3444 (28/07/2014 high).
GBPUSD has broken the key support at 1.6693 (see also the 200 day moving average). The short-term technical structure is negative as long as prices remain below the resistance at 1.6757 (12/08/2014 low, see also the declining trendline). Another resistance lies at 1.6844 (13/08/2014 high). In the longer term, the break of the key support at 1.6693 (29/05/2014 low, see also the 200 day moving average) invalidates the positive outlook caused by the previous 4-year highs. However, the lack of medium-term bearish reversal pattern and the short-term oversold conditions do not call for an outright bearish view. A key support now stands at 1.6460 (24/03/2014 low).
USDJPY is pushing higher, moving above its key resistance at 103.02/103.09 (30/07/2014 high). A further rise towards the resistance at 104.13 is favoured. Hourly supports can be found at 102.91 (intraday low) and 102.52 (19/08/2014 low). A long-term bullish bias is favoured as long as the key support 100.76 (04/02/2014 low) holds. A confirmed break to the upside out of the consolidation phase between 100.76 (04/02/2014 low) and 103.02 would favour a resumption of the underlying bullish trend. Strong resistances can be found at 105.44 (02/01/2014 high) and 110.66 (15/08/2008 high).
USDCHF has broken the resistance implied by its declining channel and is now challenging the resistance at 0.9115. A short-term support lies at 0.9059 (19/08/2014 low), while a key support stands at 0.9008 (see also the rising trendline). From a longer term perspective, the recent technical improvements call for the end of the large corrective phase that started in July 2012. The long-term upside potential implied by the double-bottom formation is 0.9207. Furthermore, the break of the resistance at 0.9037 calls for a second leg higher (echoing the one started on 8 May) with an upside potential at 0.9191. As a result, a test of the strong resistance at 0.9156 (21/01/2014 high) is expected.

