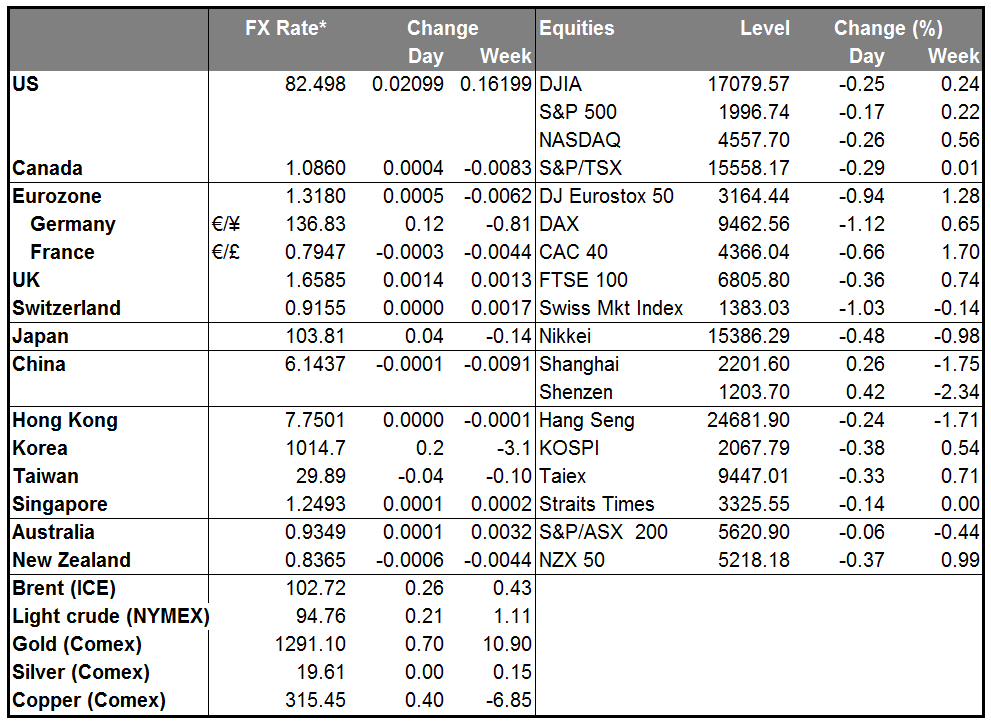
The market was braced for a small downward revision to US 2Q GDP, but in the event it was revised up to 4.2% qoq SAAR from 4.0%. Moreover the mix of growth was good: final domestic demand was revised up as business investment grew more than initially thought, the net exports contribution was revised up and the inventories contribution was revised down. This favorable mix bodes well for growth in the rest of the year and sent the dollar up against almost all the currencies we track (the only exception being BRL). That despite a small (1.5 bps) drop in Fed funds rate expectations, further small falls in bond yields, and lower stock markets around the world. (Although with even Spanish 10-year yields below US Treasury yields, US bond still have an overwhelming rate advantage over their Eurozone equivalents, so I’m not sure how much difference yield differentials make any more.) In any event, either the stronger growth or the worsening tensions in Ukraine turned sentiment for the dollar around. Today will be a tug-of-war between end-of-month dollar selling and flight-to-safety demand for the US currency. I expect the latter to win.
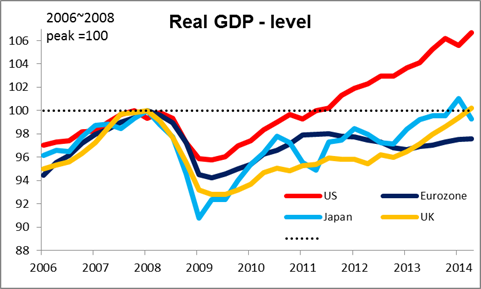
The US data was also in sharp contrast with Japan’s numbers out overnight. Spending has shown no signs of recovering after the hike in the consumption tax in April. Household spending fell far more than expected and the fourth year-on-year decline, while retail sales, expected to be up modestly, were down 0.5% mom. Weak demand fed through to weak output and industrial production rose only 0.2% mom, hardly the strong bounce that was expected after June’s sharp decline. The unemployment rate unexpectedly rose to 3.8% (market forecast: unchanged at 3.7%) despite the job-offers-to-applicants ratio staying at the highest level since 1992, indicating a skills mismatch that growth won’t necessarily fix. And inflation slowed further, as expected, with the national CPI for July easing to +3.4% yoy from +3.6%. Excluding the impact of the rise in the consumption tax, CPI rose a steady 1.3%, still below the BoJ’s 2% target. The news adds to my conviction that the BoJ will have to take further action to boost the economy later this year, because Japan, like Europe, is running out of steam. (Note: boost the economy = weaken the yen.) Nonetheless JPY gained on many of its crosses as the stock market declined and tensions in Ukraine increased, adding a bid to safe haven assets (including gold).
Today’s indicators: The key indicator during the European day will be Eurozone CPI for August. It’s expected to slow to +0.3% yoy from +0.4% yoy in July. On top of the low German CPI print, the weak Eurozone CPI may give an additional impetus for the ECB to “acknowledge” this development and take further measures at next week’s meeting. I expect that they will make some announcement about a program to buy asset-backed securities (ABS), given the Bank has hired an outside advisor to advise on such a program.
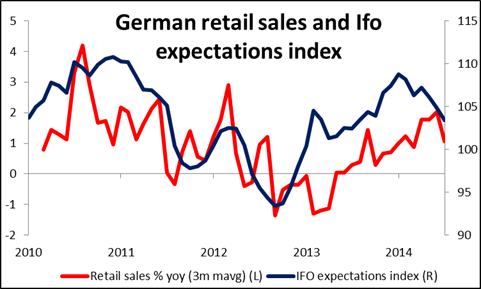
Germany’s retail sales for July fell mom, another sign of weakness in the supposed locomotive of growth in Europe. We also have the Eurozone’s unemployment rate for July, which is expected to remain unchanged from June.
Norway’s official unemployment rate for August is coming out and the market consensus is for the rate to decline. The NOK-supportive figure may offset Wednesday’s poor AKU unemployment rate and strengthen the Norwegian krone, especially against its Nordic counterpart SEK. Riksbank publishes its Banking report and Norges bank releases the Q3 expectations survey.
In the UK, the Nationwide house price index for August is expected to rise at the same mom pace as in the previous month.
From Canada, the GDP for June is expected to have increased by 0.2% mom, a slowdown from +0.4% in May, however, the yoy rate is expected to accelerate to 3.0% from 2.3%.
In the US, personal income and personal spending for July are expected to have decelerated a bit. The PCE deflator and core PCE are forecast to show the same yoy rate of growth as in June, in line with the unchanged 2nd estimate of Q2 core PCE in Thursday’s GDP figures. The final U of Michigan consumer confidence sentiment and the Chicago purchasing managers’ index both for August are expected to show some improvement, which may be enough to keep the dollar on its upward trajectory.
The Market
EUR/USD lower but still above 1.3152
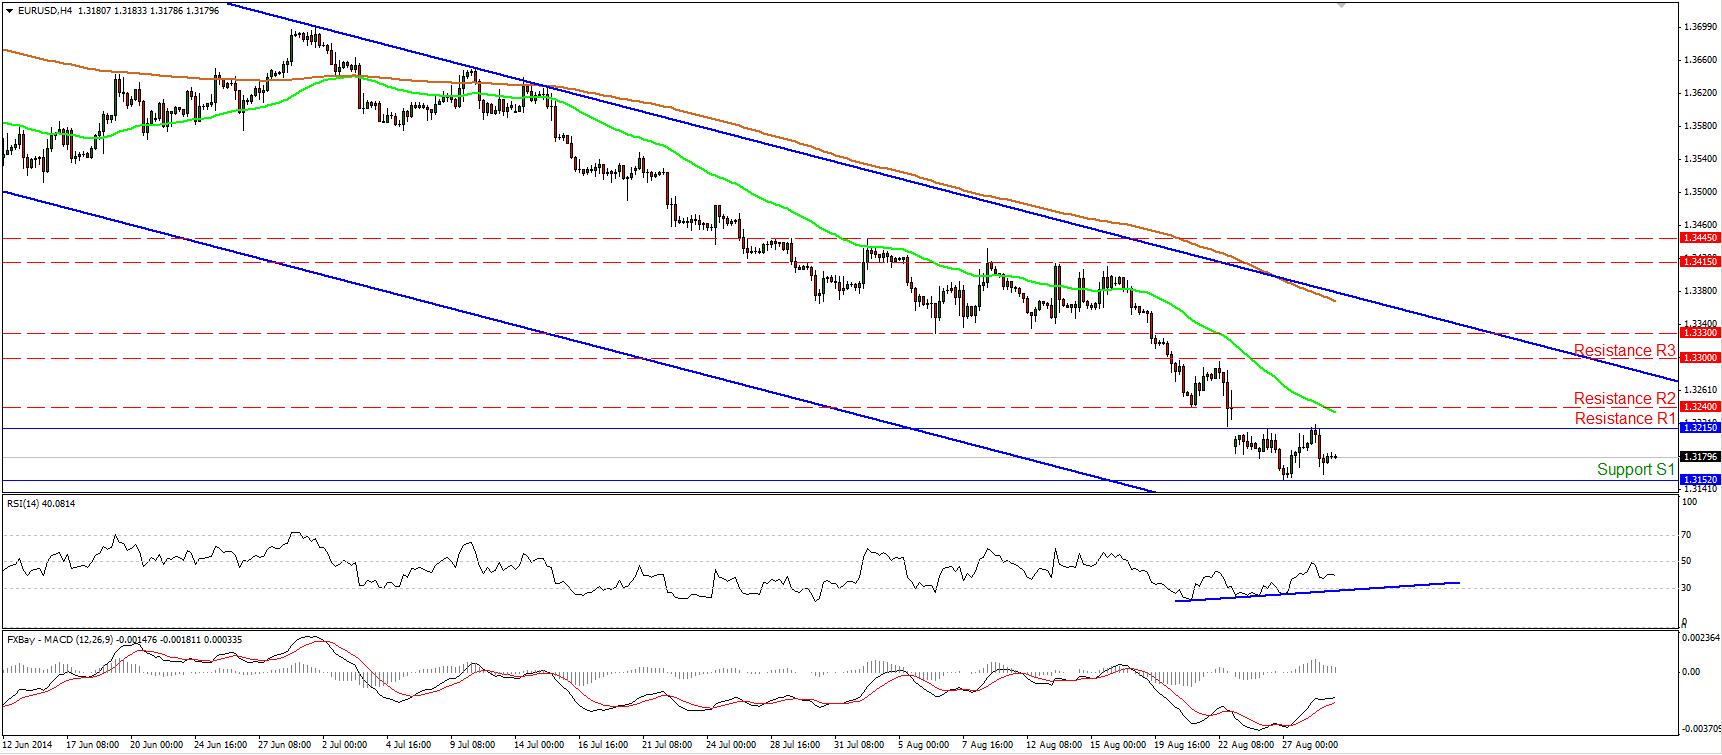
EUR/USD moved lower on Thursday after the surprisingly strong revision of the US GDP for Q2. The rate declined after finding resistance near the 1.3215 (R1) barrier, but failed to overcome the recent low of 1.3152 (S1) and remained within the range between those two barriers. As a result I would maintain my neutral view at the moment until the pair exits that range. A slowdown in Eurozone’s preliminary CPI for August is likely to give a reason for a push below 1.3152(S1). Nevertheless, I believe that such a move could be limited near the key support of 1.3100 (S2), near the lower boundary of the blue downside channel connecting the highs and the lows on the daily chart. On the other hand, a clear move above the barrier of 1.3240 (R2), could probably support the scenario that the upside corrective phase have started a bit earlier than I would expect.
• Support: 1.3152 (S1), 1.3100 (S2), 1.3000 (S3)
• Resistance: 1.3215 (R1), 1.3240 (R2), 1.3300 (R3)
USD/JPY in a corrective mode
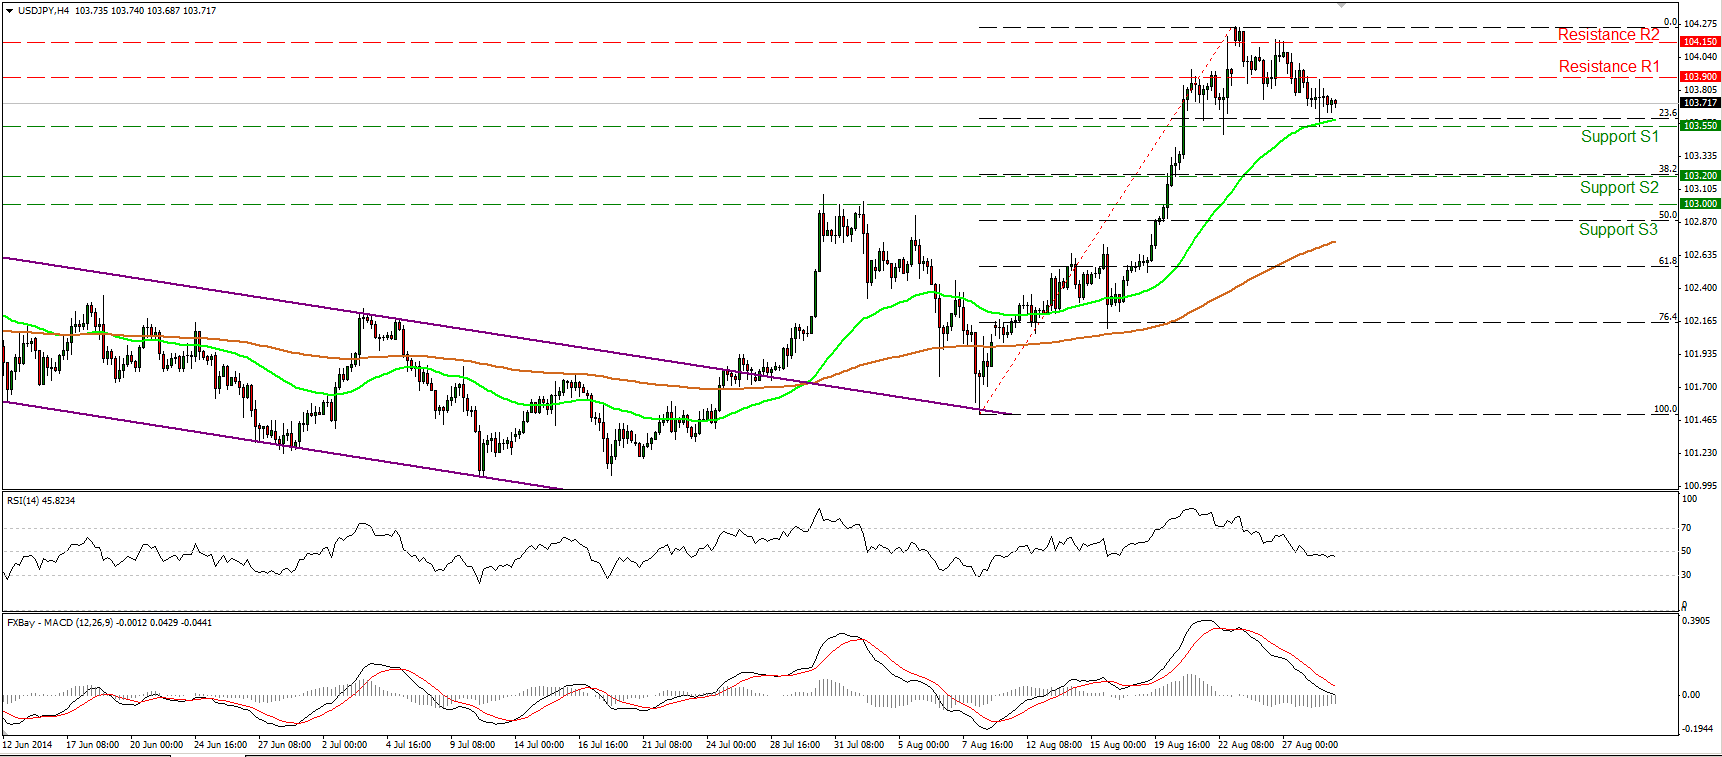
USD/JPY tumbled after Monday’s false break above the 104.15 (R2) line. Today, during the early European morning, the rate is trading slightly above the 23.6% retracement level of the 8th – 25th August upside wave, near our support line of 103.55 (S1). A decisive move below that area is likely to target the next support line at 103.20 (S2), which coincides with the 38.2% retracement level of the aforementioned advance. The RSI lies below its 50 line, while the MACD is now testing its zero line and could become negative any time soon. In the bigger picture, I still see a newborn long-term uptrend, since the price structure remains higher highs and higher lows above both the 50- and the 200-day moving averages. As a result, I would consider any possible near-term declines as a retracement before the bulls take the reins again.
• Support: 103.55 (S1), 103.20 (S2), 103.00 (S3)
• Resistance: 103.90 (R1), 104.15 (R2), 104.85 (R3)
EUR/GBP back negative
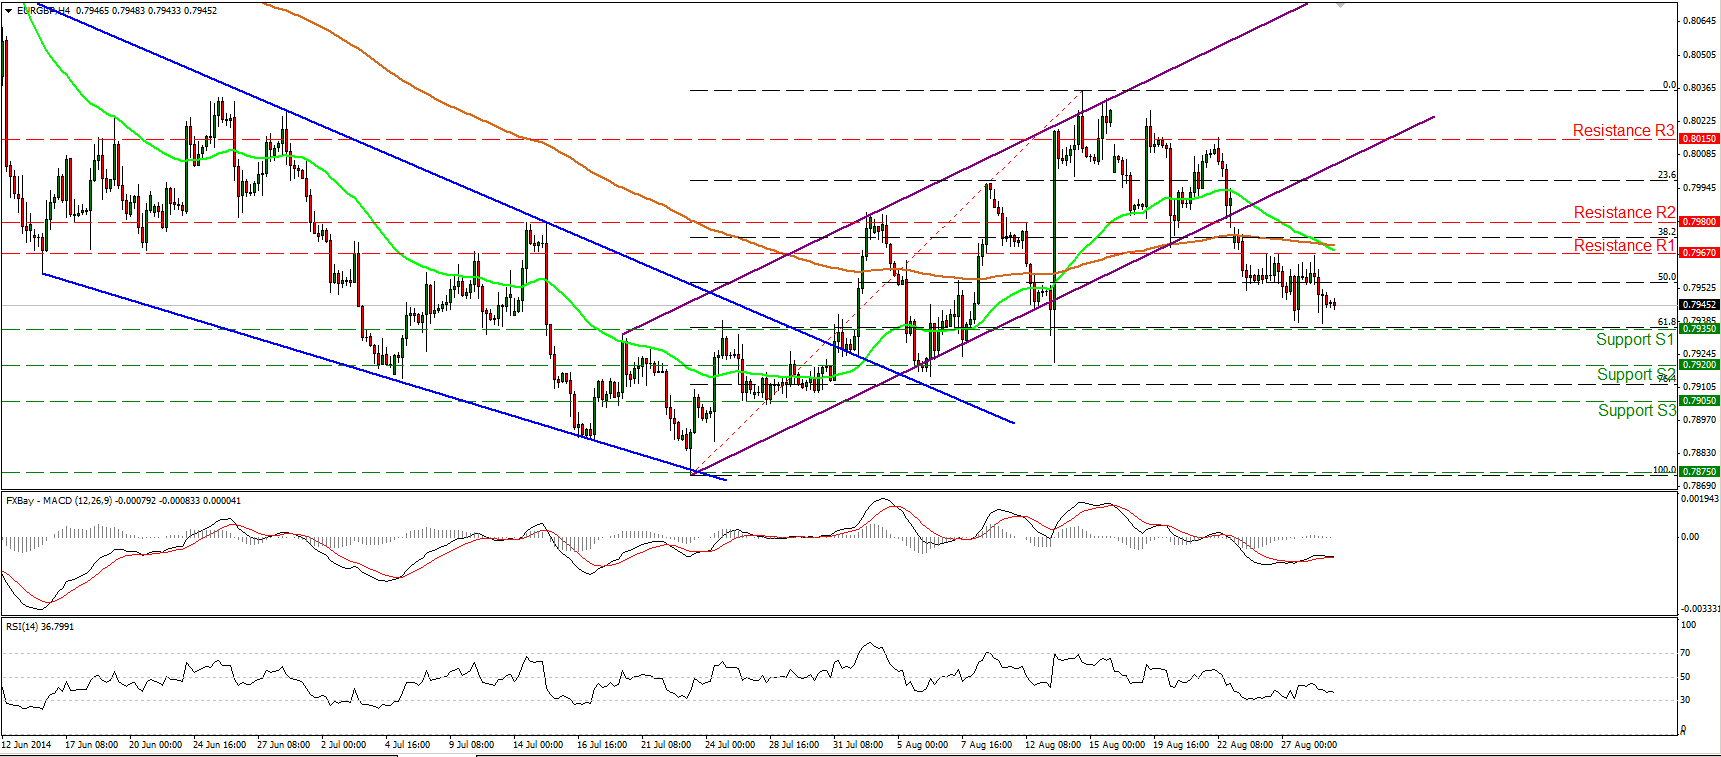
EUR/GBP fell below the lower bound on the upside channel on Monday, turning the near term picture back to the downside. Today, the pair is trading slightly above our support of 0.7935 (S1), which happens to be the 61.8% retracement level of the 23rd July- 14th August short-term uptrend. I would expect a dip below that line to target our next support at 0.7920 (S2). As long as the rate is printing lower highs and lower lows below the lower bound of the prior upside channel, I consider the short-term bias to be to the downside. On the daily chart, the major downtrend is still intact, as defined by the downtrend line drawn from back the high of the 1st of August 2013. Nevertheless, I would wait for a clear dip below the low of the 23rd of July at 0.7875 before regaining confidence on that long-term downside path.
• Support: 0.7935 (S1), 0.7920 (S2), 0.7905 (S3)
• Resistance: 0.7967 (R1), 0.7980 (R2), 0.8015 (R3)
Gold continues higher
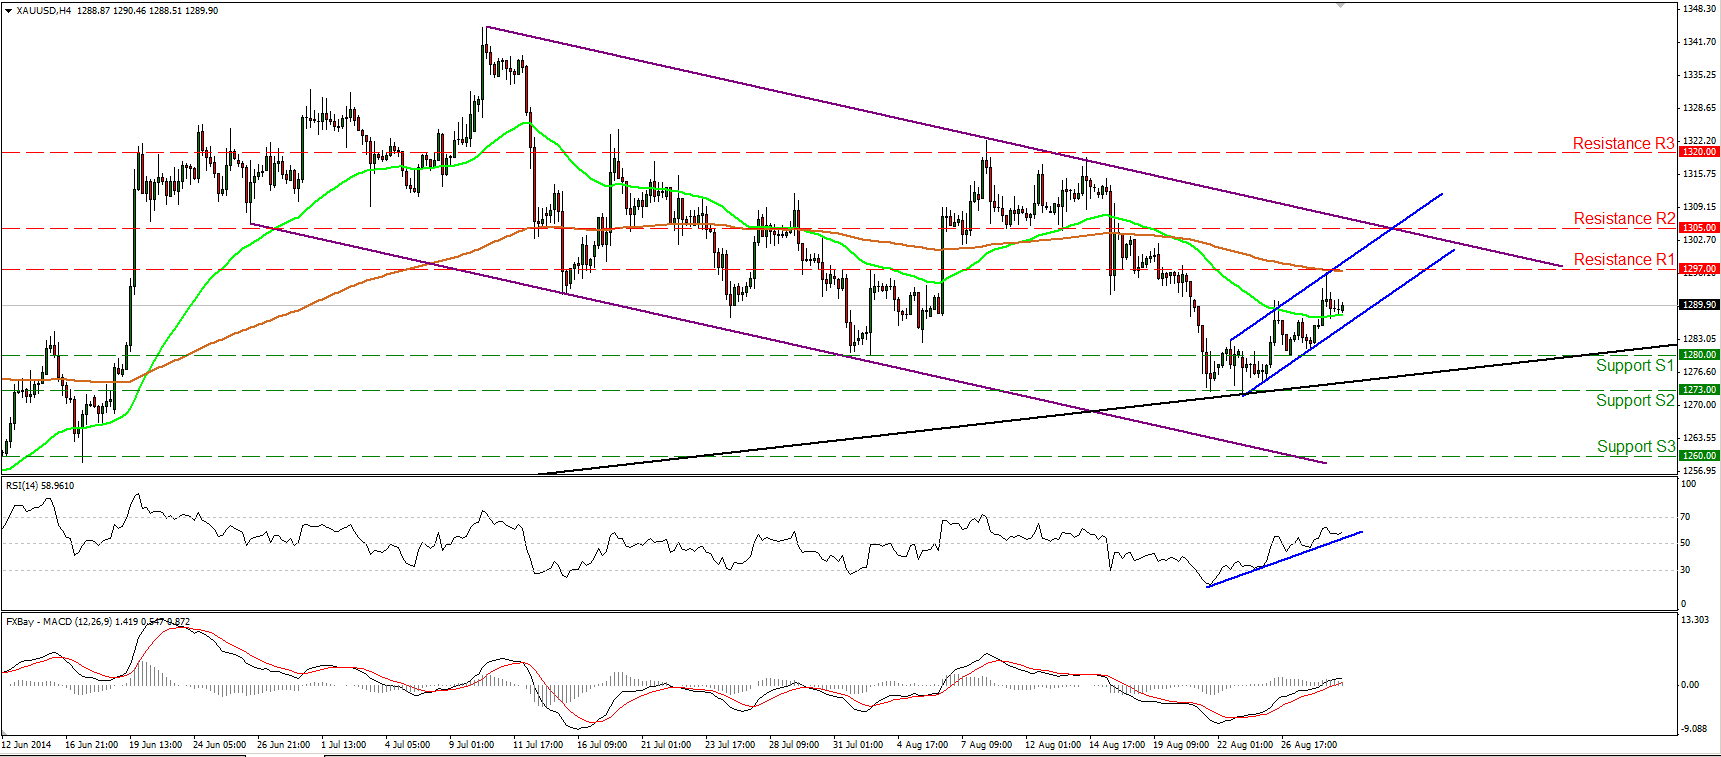
Gold moved higher to reach the 200-period moving average and the line of 1297 (R1) before pulling back somewhat. The RSI continues to follow its blue upside support line, while the MACD entered its positive field, amplifying the case that another move near the 1297 (R1) barrier is possible. An upside violation of that barrier could aim for the 1305 (R2) obstacle near the upper boundary of the purple downside channel, connecting the highs and the lows on the daily chart. Both the 14-day RSI and the daily MACD remain below their downside resistance lines. As long as this is the case and as long as the yellow metal is trading within the purple downside channel, I would see any possible upside waves as a corrective move, at least for now.
• Support: 1280 (S1), 1273 (S2), 1260 (S3)
• Resistance: 1297 (R1), 1305 (R2), 1320 (R3)
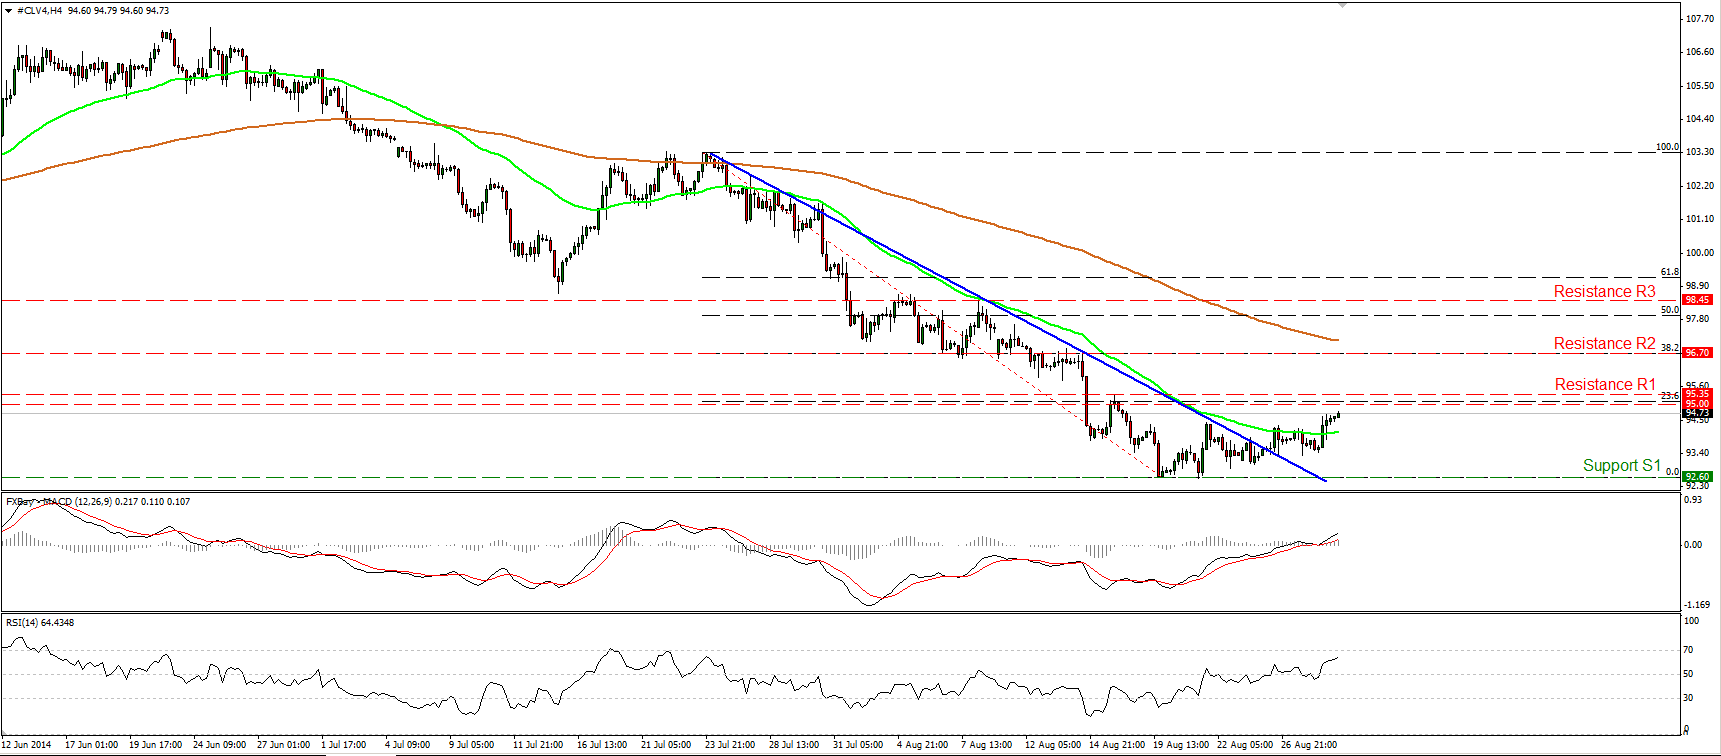
WTI ready to challenge the 95.00 line
WTI moved higher on Thursday, and now it seems ready to challenge the psychological barrier of 95.00 (R1), which lies near the 23.6% retracement level of the 23rd July – 19th August downtrend. I will maintain my view that we need a clear move above the 95.00/35 zone to trigger further upside, perhaps towards the next resistance, at 96.70 (R2), which coincides with the 38.2% retracement level of the prior downtrend. The RSI lies above its 50 line and is now pointing up, while the MACD entered its positive field, confirming the recent bullish momentum. On the daily chart, the 14-day RSI continued moving higher after exiting oversold conditions, while the MACD remains above its signal line and is pointing up. All the above corroborate my view that the upside wave is likely to continue.
• Support: 92.60 (S1), 91.60 (S2), 90.00 (S3)
• Resistance: 95.00 (R1), 96.70 (R2), 98.45 (R3)

