
Those who were caught off guard by the August-September correction ignored a deluge of fundamental, technical and economic data. (See August’s Market Top: 15 Warning Signs.) Median U.S. stock valuations had surpassed 2000 and 2007. Technical deterioration in market breadth virtually guaranteed a precipitous drop in the benchmarks. And the “decoupled-from-the-rest-of-the-world” U.S. economy? Feeble wage growth, waning consumer sentiment, stalling retail sales, revenue contraction at U.S. businesses and a free-fall in U.S. manufacturing challenged the notion that the domestic economy’s foundation remained solid. (See September’s 13 Economic Charts That Wall Street Doesn’t Want You To See.)
In spite of unambiguous evidence, naysayers continued to tout the positives. They’d insist that the consumer – who accounts for roughly 70% of U.S. economic output – is vigorous. They’d chat up housing price gains, new home sales and homebuilder confidence. Perhaps most notably, they’d point to the 5.1% unemployment rate as “Exhibit A” in a robust rebound.
In recent commentary, I challenged the idea that consumption is as resilient as the media portray. For one thing, the Conference Board’s Consumer Sentiment Survey sits at its lowest point of 2015, with the Future Expectations sub-index declining at a faster clip than the Current Situation sub-index. For another, wage growth at its slowest year-over-year rate since 1982, forcing middle class Americans to hope that gas prices and interest rates both remain lower for longer. Unfortunately, the Federal Reserve seems hell-bent on raising borrowing costs before ultimately lowering them in the near future, if only to declare a hollow victory.
I could spend a great deal of time debunking the idea that the consumer can afford to be as active going forward as he/she had been earlier in the recovery. Instead, I will let the current retail data do the heavy lifting.

“Well, Gary,” some have written to me (and I am paraphrasing here). “You’ve done a remarkable job highlighting global stagnation and domestic sluggishness. But you must acknowledge that housing is in spectacular shape and that 5.1% unemployment is wonderful.” I wish that I could acknowledge those things. I really do.
Let’s start with the real estate ruse. Surging prices on property values reflect the same thing that record high stock prices reflect; that is, $7.5 trillion in federal government spending coupled with $3.5 trillion in U.S. Federal Reserve quantitative easing as well as seven years of zero-bound rate policy reflated the prices of key assets (e.g., stocks, real estate, etc.). Wealthy individuals benefited the most from the stimulus. Circa 2011-2013, second home buyers and foreign investors fueled the rebirth of real estate. I was one of them. I picked up a mixed-use property via short sale for roughly 40% less than the current asking price for a comparable mixed-use home.
Whereas investors like myself ignited the buying spree between 2011 and 2013, today’s housing market depends more upon mortgage-dependent, owner-occupants. In fact, RealtyTrac recently revealed that all-cash home sales fell to the lowest level since well-to-do buyers were scooping up bargains in 2008. Meanwhile, low-down payment FHA loans are climbing rapidly, as stagnant personal income is unable to keep up with extraordinary home price appreciation. Even those middle-class folks who want to get in the front door with a low-down FHA-backed loan are hesitant. How can you tell? Home-ownership rates have not been this low since 1967.

So where’s the post-recession recovery in home-ownership? It does not exist. Wealthy individuals (myself included), residential real estate trusts and foreign buyers have priced out middle-class families and first-time homebuyers from participation. It follows that with rents skyrocketing and debt-to-income ratios hindering prospective first-timers, existing home sales remain a fraction of what they were a decade earlier. (And that’s with a nearly complete recovery in median home price.)

Is housing doing well, then? Or are housing prices doing well? I submit the latter. In fact, the unanticipated drop (-1.4%) in the most recent data on pending home sales is already being attributed to prices getting beyond the reach of today’s prospective purchasers.
For some, the distinction does not make a difference. For me, it is no different than asking whether corporations are performing well or are their share prices near all-time highs. Indeed, corporations are likely to finish out calendar year 2015 with four full quarters of year-over-year declines in sales. One full year of deterioration in revenue? That’s the stuff of recessionary data.
Again, then, is housing doing well or are housing prices near all-time peaks? Are corporations doing well at selling their products and services or have those companies simply benefited from reflated share prices?

“Okay, Gary, I get your point on stocks and real estate as they pertain to the economy,” you say. “But don’t try to tell me that unemployment hitting 5.1% is a bad sign.” No, I won’t tell you that it is a bad sign. I will tell you that headline U-3 unemployment is a misleading indicator of employment well-being in our country.
For those economists/analysts who choose not to live on “Planet Delusional,” the first metric to look at is the U-6 rate. The Bureau of Labor Statistics (BLS) describes U-3 as the total number of unemployed as a percentage of the civilian labor force. In contrast, the broader U-6 measure is U-3 plus discouraged workers (i.e., those who have indicated that they want a job and have looked for work in the past 12 months), plus those who are marginally attached to the labor force and those who are looking for full-time work but needed to settle on a part-time job.

Without question, this measure of unemployment has shown steady improvement since the end of the recession. However, it is important to recognize that unemployment at 10.3% (U-6) is far worse than the advertised 5.1%; 10.3% is also greater than the pre-recession data point of 8.5% U-6 unemployment.
Unfortunately, U-6 still does not depict the gravity of the problem of unemployment in America. It does not take into account the decline in working-aged individuals who have left the labor force. For the most part, historically speaking, the percentage of working-aged people (16+) in the labor force dropped during recessions, yet recovered alongside employment gains as long-term discouraged folks returned to the pool. In the last two recessions, however, this has not been the case.
Many assume, erroneously, this is because older workers in the 55+ and 65+ demographic are baby boomers retiring. Obviously, there would be some of that. Yet the reality of the data is that the only part of the labor force participation rate that is gaining ground are the older workers in the 65+ demographic. Older people are needing to work longer than they did before. Worse yet, the prime population for workers between the ages of 25-54 are dropping out of the workforce like flies.

There are roughly 94 million working-age people who are neither employed nor making plans to get a job. That is 37.4% of working-aged individuals – a percentage that goes all the way back to 1977. Is it just grandma and grandpa retiring? Nope. It is the dismal circumstances for the 25-54 age bracket where 80.5% are employed – a percentage that has not been this low since 1984.
Whether one describes unemployment as a function of U-6 (10.3%), prime workers between the ages of 25-54 in the labor force (19.5%) or the entire kaboodle via 94 million working-aged people (37.4%), these data points are a far cry from the rosier 5.1% U-3 data point. They also show us that jobs have not actually recovered from the recession yet and/or, in the case of labor force participation, have actually gotten worse. We also know that higher-paying careers have given way to lower-paying jobs over the course of the last two recessions (2000-2001, 2008-2009); median household income has not recovered.

Now, tell me again why the Fed would raise borrowing costs? With prominent global economies already contracting, U.S. manufacturers faltering, U.S. corporate revenue declining, reflated asset prices deflating (e.g., stocks, high yield bonds, etc.), household income falling, wages stagnating, inflation slipping, employment fizzling and real estate failing to inspire?
In September 18’s article, Why the S&P 500 Is Likely To Retest The Lows of 1870, we discussed the reasons why prominent ETFs like SPDR S&P 500 (NYSE:SPY) ETF Trust (ASX:SPY) had been following the 2011 euro-zone crisis playbook. Indeed, SPY has behaved precisely as we expected.

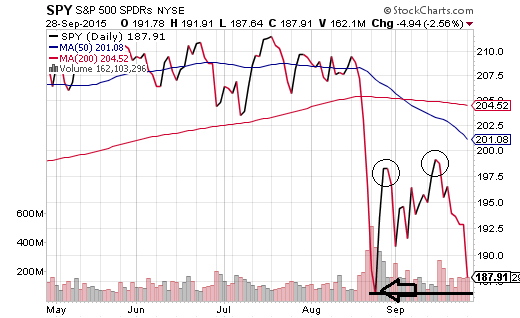
The burning question for investors now? Whether or not the late August lows will hold. Short of a one- or two-day breach of the resistance line, I might expect a buying frenzy to keep bull market dreams alive. However, the longer-term health of the bull market is almost entirely dependent on Federal Reserve policy and the communication of that policy. In particular, chairwoman Yellen and her colleagues cannot rely on merely deferring rate hikes or moving ahead with rate hikes; rather they’d want to communicate the anticipated pace and the anticipated amounts until rate hike conclusion. Anything less than greater clarity on what the Fed is likely to do over the next 6-9 months would be a net negative for risk assets.
Take your cues from the credit markets. In particular, as long as the iShares 7-10 Year Treasury Bond (NYSE:IEF):iShares iBoxx $ High Yield Corporate Bond (NYSE:HYG) price ratio continues to climb, you’re better off with a larger-than-usual cash/cash equivalent balance. When IEF:HYG is falling in a meaningful manner, that’d be the time to think about incremental purchases back into stock assets and other risk holdings.

Disclosure: Gary Gordon, MS, CFP is the president of Pacific Park Financial, Inc., a Registered Investment Adviser with the SEC. Gary Gordon, Pacific Park Financial, Inc, and/or its clients may hold positions in the ETFs, mutual funds, and/or any investment asset mentioned above. The commentary does not constitute individualized investment advice. The opinions offered herein are not personalized recommendations to buy, sell or hold securities. At times, issuers of exchange-traded products compensate Pacific Park Financial, Inc. or its subsidiaries for advertising at the ETF Expert web site. ETF Expert content is created independently of any advertising relationships.