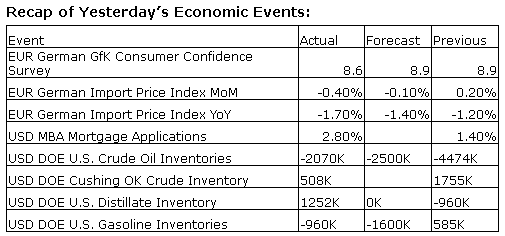
Upcoming US Events for Today:- GDP for the Second Quarter will be released at 8:30am. The market expects a quarter-over-quarter increase of 4.0%, consistent with the previous report.
- Weekly Jobless Claims will be released at 8:30am. The market expects Initial Claims to show 300K versus 298K previous.
- Pending Home Sales for July will be released at 10:00am. The market expects a month-over-month increase of 0.5% versus a decline of 1.1% previous.
- Kansas City Fed Manufacturing Index for August will be released at 11:00am. The market expects 9, consistent with the previous report.
Upcoming International Events for Today:
- German Unemployment Rate for July will be released at 3:55am EST. The market expects 6.7%, consistent with the previous report.
- Euro-Zone Economic Sentiment for August will be released at 5:00am EST. The market expects 101.5 versus 102.2 previous. Industrial Sentiment is expected to show –4.7 versus –3.8 previous. Consumer Sentiment is expected to show –10.0 versus –8.4 previous.
- German CPI for August will be released at 8:00am EST. The market expects a year-over-year increase of 0.8%, consistent with the previous report.
- Japan CPI for July will be released at 7:30pm EST. Excluding Food, the market expects a year-over-year increase of 3.3%, consistent with the previous report.
- Japan Unemployment Rate for July will be released at 7:30pm EST. The market expects 3.7%, consistent with the previous report.
- Japan Industrial Production for July will be released at 7:50pm EST. The market expects a year-over-year decline of 0.3% versus an increase of 3.2% previous.
The Markets
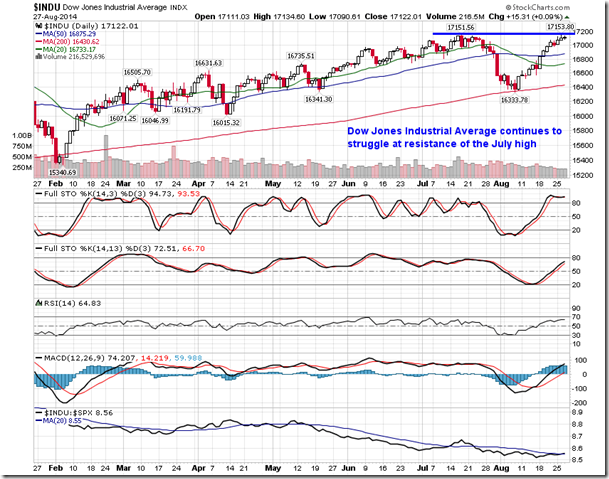
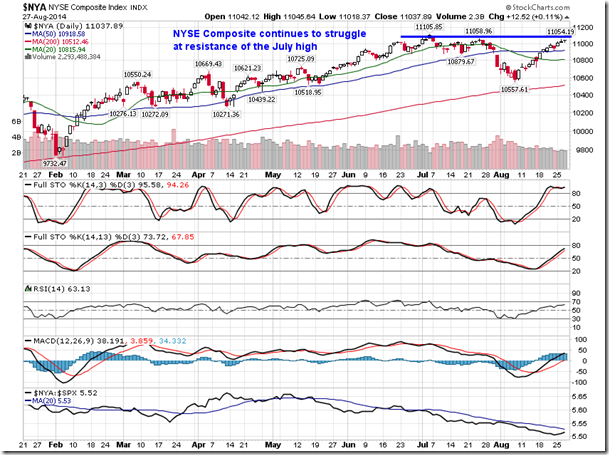
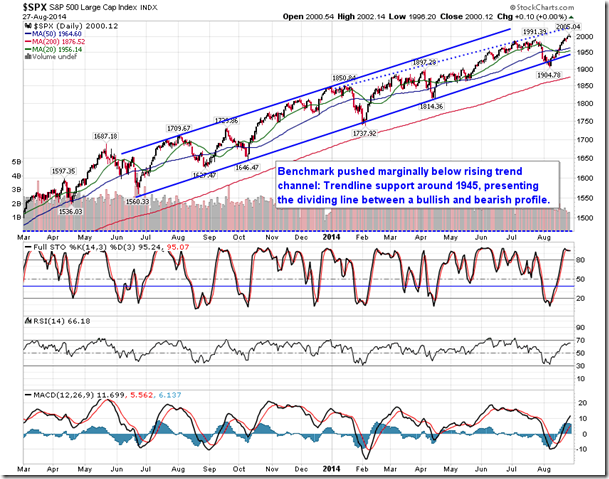
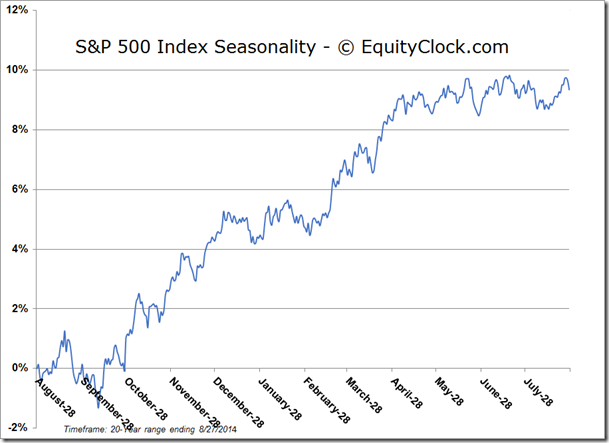
Stocks ended around the flat-line on Wednesday as investors show indecision to the new all-time highs on the S&P 500 Index; the Dow Jones Industrial Average and NYSE Composite continue to battle with resistance around the July highs. Momentum indicators for the major equity benchmarks are showing signs of exhaustion as Stochastics and the MACD Histogram start to roll over. With investors showing a lack of conviction to equities, as suggested by the low volume trading environment, renewed upside momentum may be difficult to achieve in absence of a market moving catalyst. September is just two trading days away and historical tendencies for upside catalysts are not favourable through the end of the third quarter.
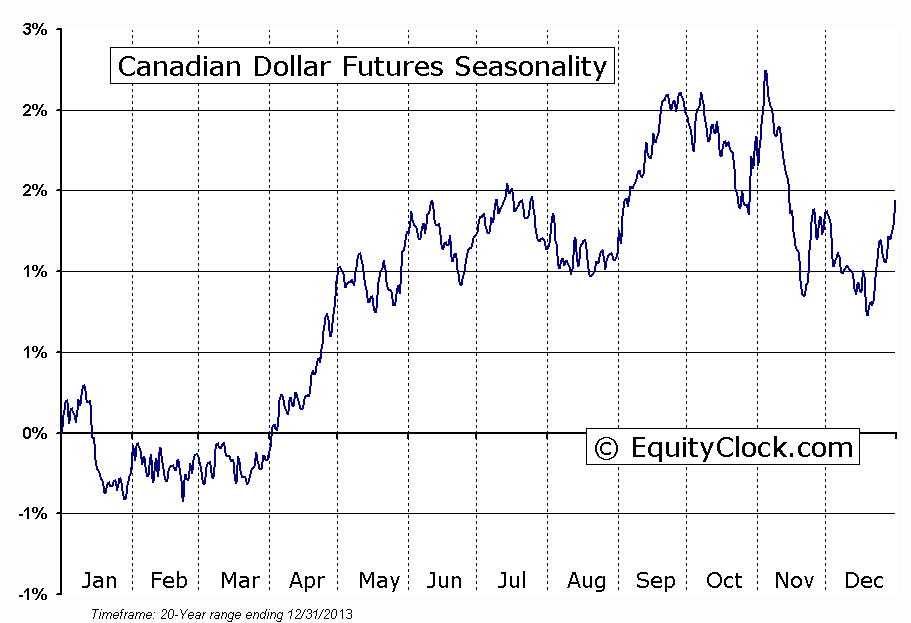
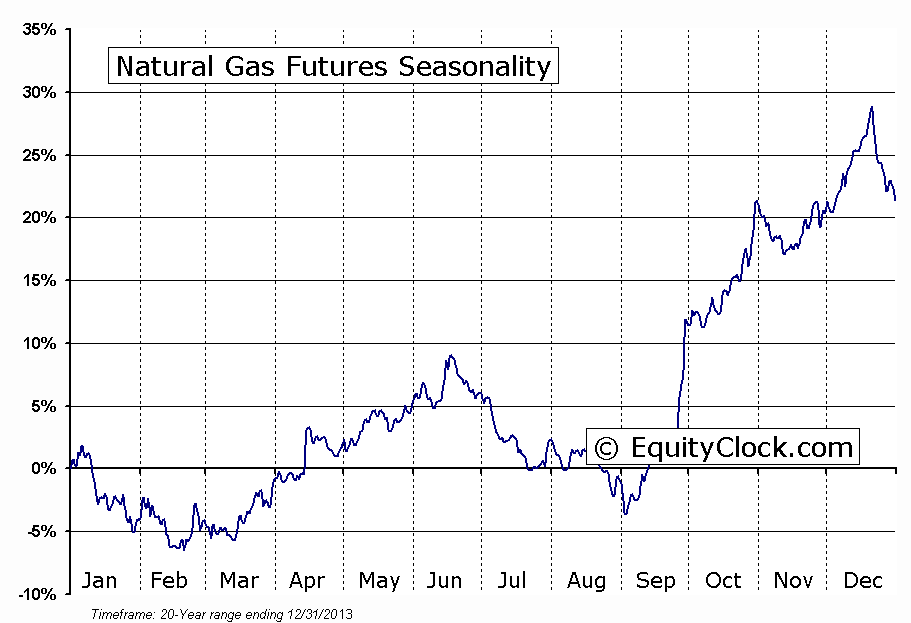
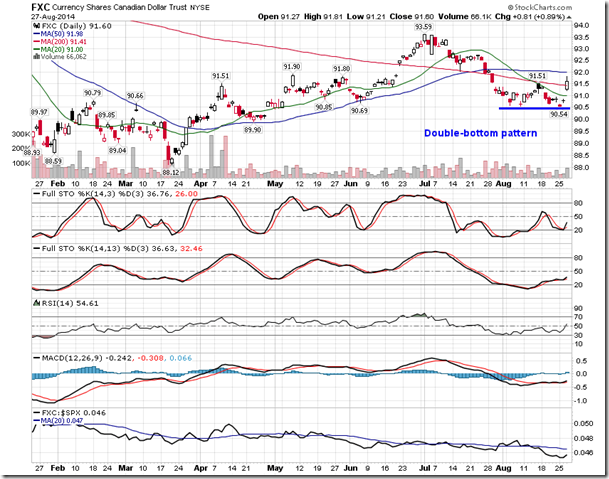
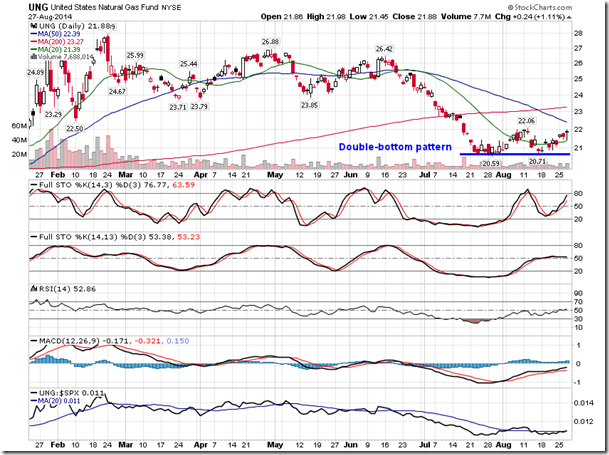
Meanwhile, two trades that seasonally begin at the beginning of September are currently showing a short-term double-bottom pattern. Over the past 20 years, the Canadian dollar and Natural Gas have both shown positive returns 70% of the time during the month of September; returns for each averaged 0.9% and 12.5%, respectively. The currency and commodity are both confirming a double-bottom based on trading activity over the past month; momentum indicators are pointing higher, rebounding from oversold levels. Seasonal tendencies for the Canadian dollar remain positive through to the end of September, while Natural Gas remains seasonally strong through the end of October.
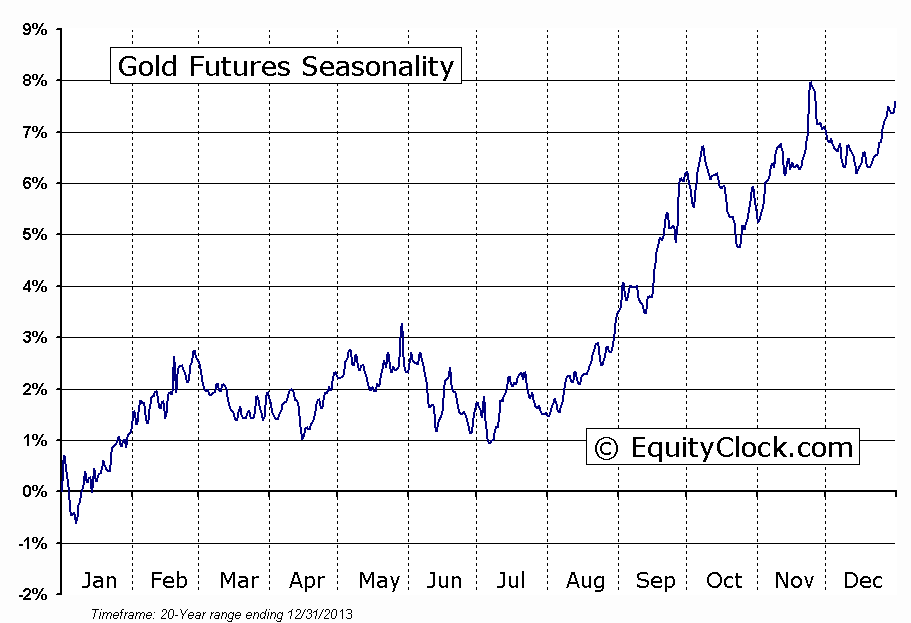
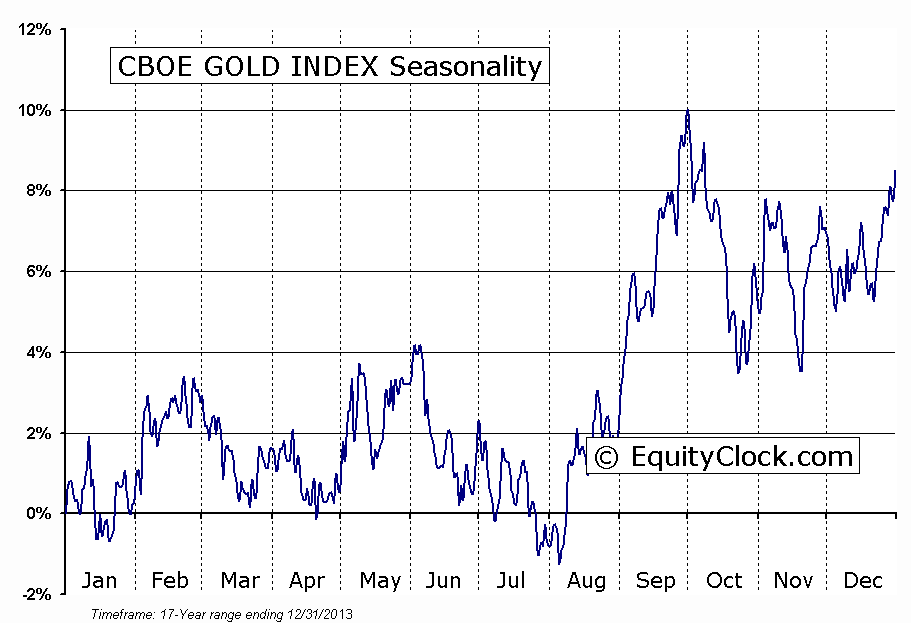
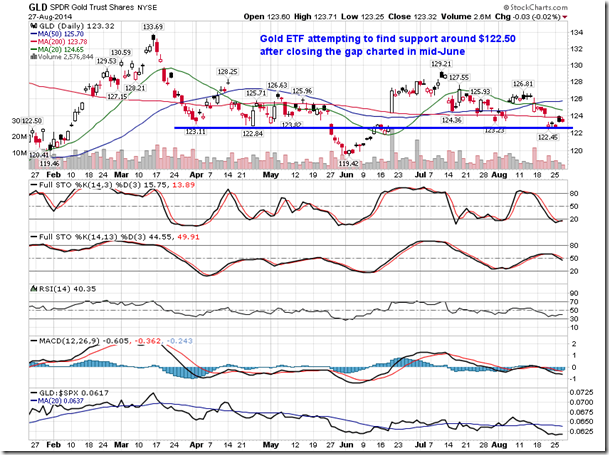
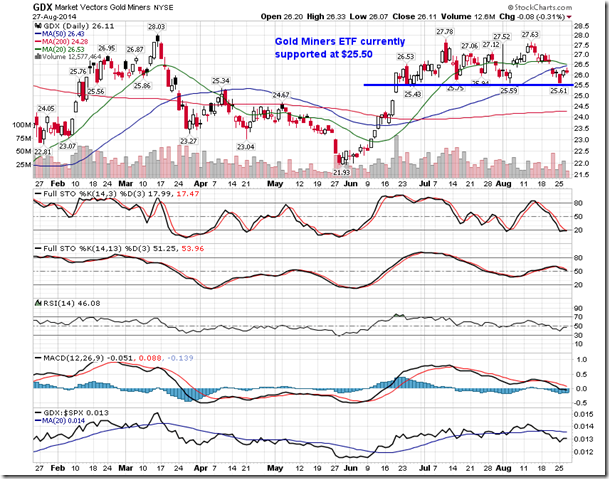
Another commodity that seasonally performs well during the month of September is Gold, which also has shown positive returns 70% of the time over the past 20 years. Gains for the commodity over the month have averaged 2.7%, providing a safe harbour away from the volatility that seasonally persists throughout the period. The month typically caps off a three-month seasonal run for the commodity that begins in July, on average. Gold began its period of seasonal strength earlier than usual this year, gapping higher in the month of June and consolidating around its 200-day moving average ever since. The commodity is now at a make or break point. Having filled the gap that was created mid-June, the commodity is attempting to find support around $1275, or around $122.75 for the the price of the SPDR Gold Trust (ARCA:GLD). The Market Vectors Gold Miners (ARCA:GDX), which follows a similar seasonal path as that of the commodity, is also testing support around $25.50. The Gold Miners ETF has been battling with resistance around $28 for over a year in what continues to look like the neckilne of a massive head-and-shoulders bottoming pattern. The pattern would be confirmed upon a break above this key level of resistance. A break of support for either the commodity or the equities would likely violate the potentially bullish setup. The 50-day moving average of both GLD and GDX continue to point higher, implying ongoing positive intermediate trends. Watch the levels of support and resistance over the days and weeks ahead as a breakdown or breakup would likely lead to an explosive move in the direction of the break.
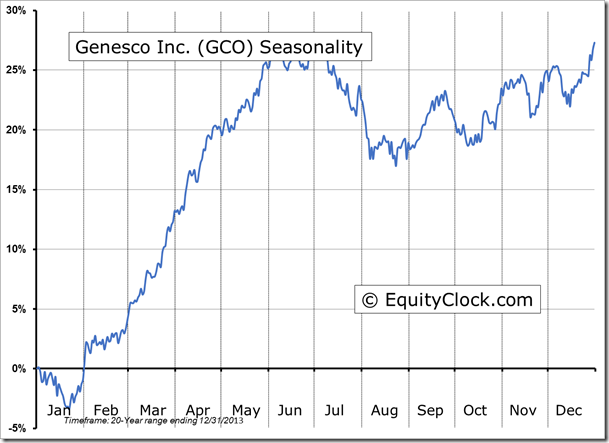
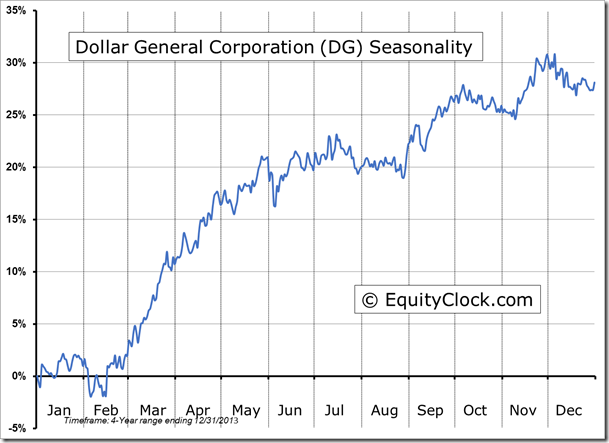
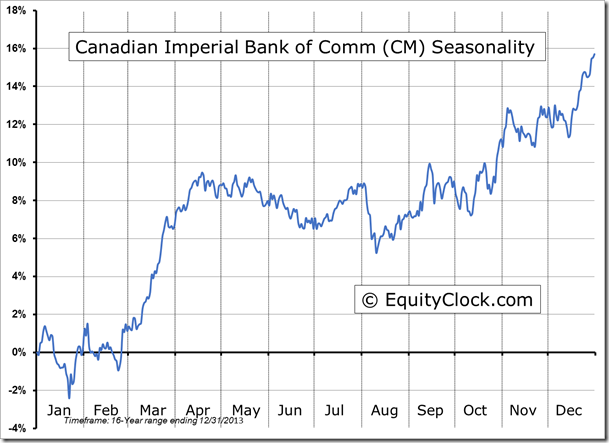
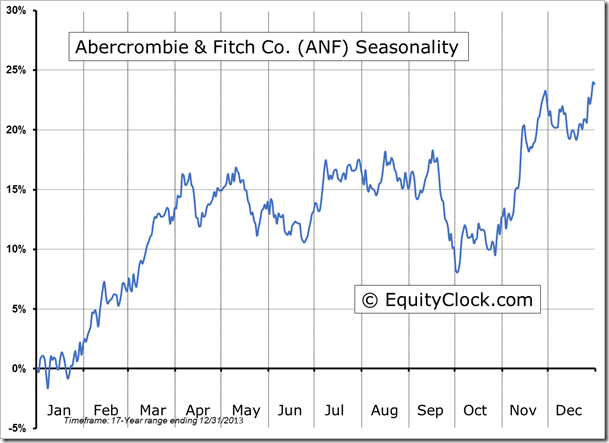
Seasonal charts of companies reporting earnings today:
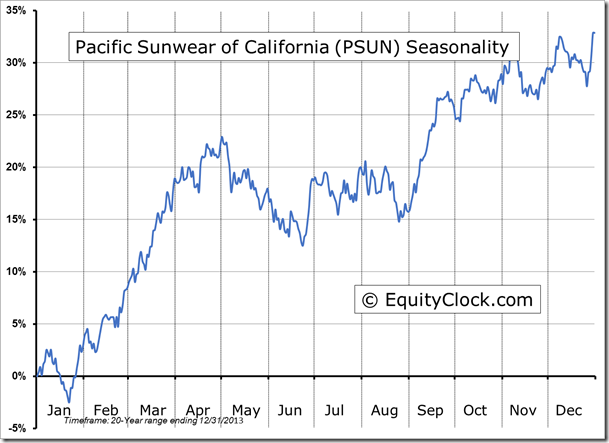
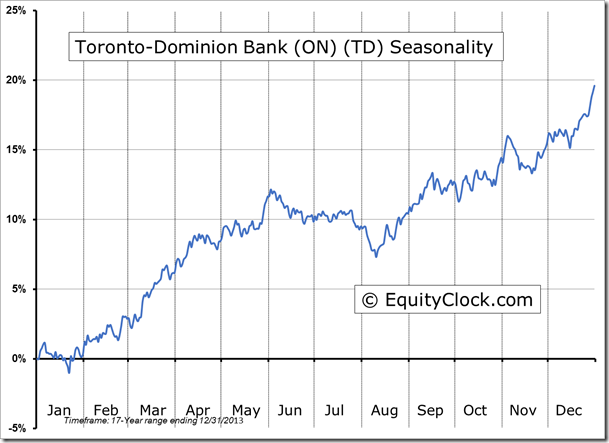
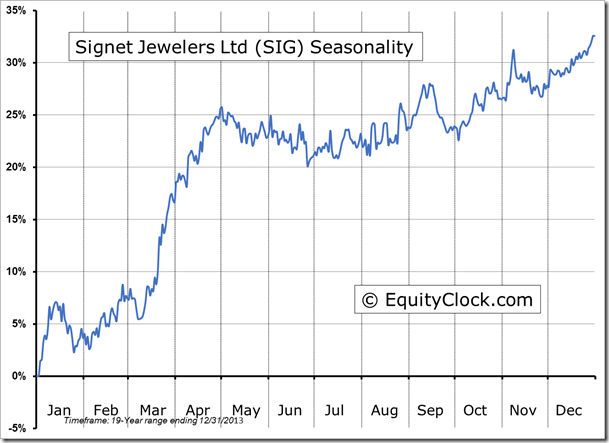
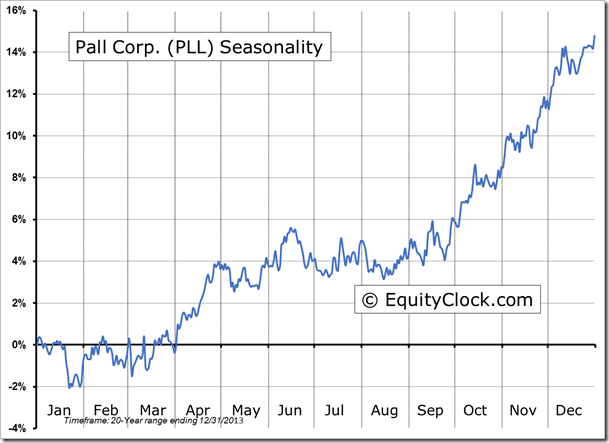
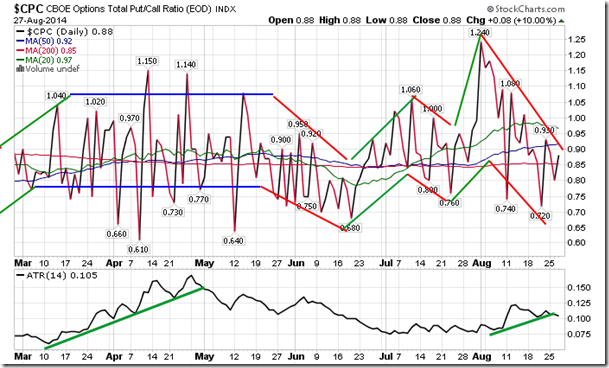
Sentiment on Wednesday, as gauged by the put-call ratio, ended bullish at 0.88.
S&P 500 Index
TSE Composite
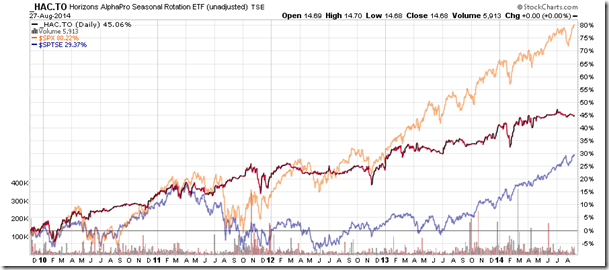
Horizons Seasonal Rotation ETF (TSX:HAC)
- Closing Market Value: $14.68 (unchanged)
- Closing NAV/Unit: $14.69 (up 0.15%)
Performance*
| 2014 Year-to-Date | Since Inception (Nov 19, 2009) | |
| HAC.TO | 2.73% | 46.9% |
* performance calculated on Closing NAV/Unit as provided by custodian
