Upcoming US Events for Today:
- S&P Case-Shiller House Price Index for July will be released at 9:00am. The market expects a year-over-year increase of 7.5% versus an increase of 8.1% previous.
- Chicago PMI for September will be released at 9:45am. The market expects 62.0 versus 64.3 previous.
- Consumer Confidence for September will be released at 10:00am. The market expects 92.5 versus 92.4 previous.
Upcoming International Events for Today:
- German Unemployment Rate for August will be released at 3:55am EST. The market expects 6.7%, consistent with the previous report.
- Great Britain GDP for the second quarter will be released at 4:30am EST. The market expects a year-over-year increase of 3.2%, consistent with the previous report.
- Euro-Zone Flash CPI for September will be released at 5:00am EST. The market expects a year-over-year increase of 0.3%, consistent with the previous report.
- Euro-Zone Unemployment Rate for August will be released at 5:00am EST. The market expects 11.5%, consistent with the previous report.
- Canada Monthly GDP for July will be released at 8:30am EST. The market expects a year-over-year increase of 2.8% versus 3.1% previous.
- Japan Tankan Survey for the third quarter will be released at 7:50pm EST. The market expects the survey of Large Manufacturers to show 10 versus 12 previous. The survey of Small Manufacturers is expected to show –2 versus 1 previous.
- China Manufacturing PMI for September will be released at 9:00pm EST. The market expects 51.3 versus 51.1 previous.
The Markets
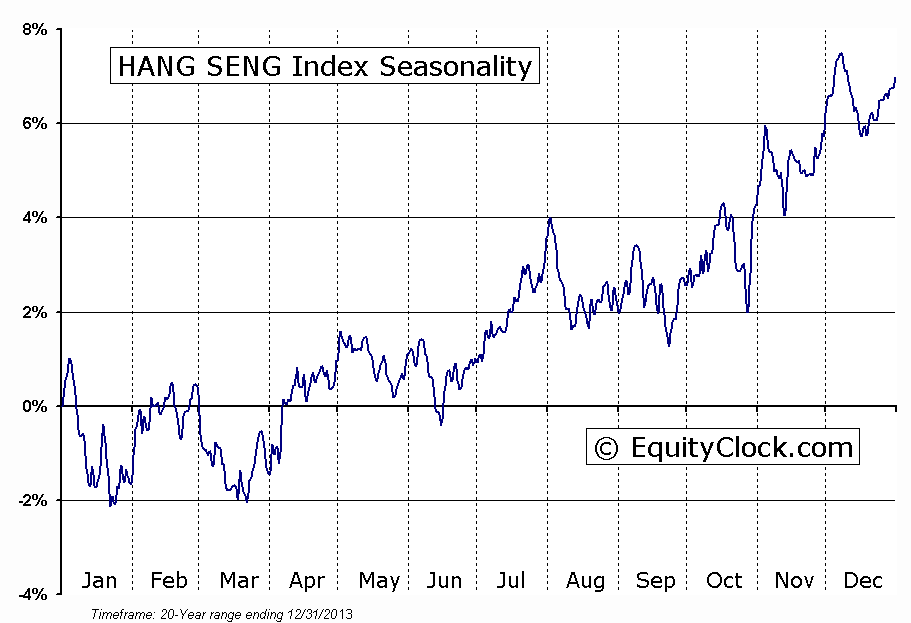
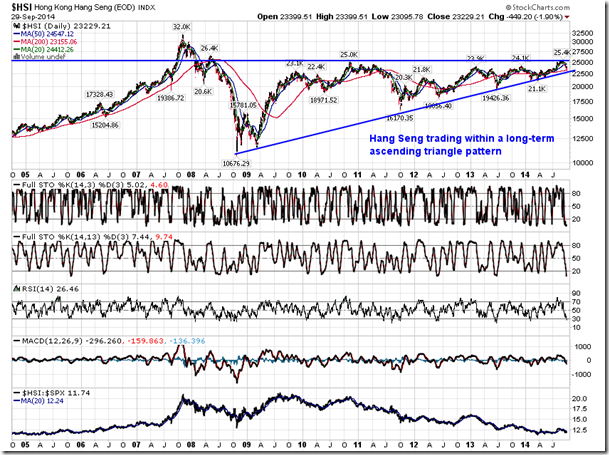
Stocks ended lower on Monday following protests in Hong Kong, which added to the list of geopolitical concerns that are now overhanging equity markets. The Hong Kong Hang Seng Index plunged 1.90% on the day, trading to the lowest level since June. The Hang Seng is now down over 8% since peaking earlier this month and momentum indicators are deeply oversold. Despite the negative short-term appearance of the chart, a longer-term look of the Hong Kong Index is showing significant upside potential. The benchmark is presently hovering around trendline support of an apparent ascending triangle pattern, a bullish setup that is confirmed upon a break above the upper limit of the pattern, in this case at 25,000. A break of the lower limit of the pattern around 22,500 would violate the bullish setup. The Hang Seng enters a period of seasonal strength at this time of year, running through to early December, for an average gain of 6%; frequency of gains over the last three months of the year top 70%. Present oversold levels around long-term support may be providing an ideal buying opportunity for the period of seasonal strength ahead.

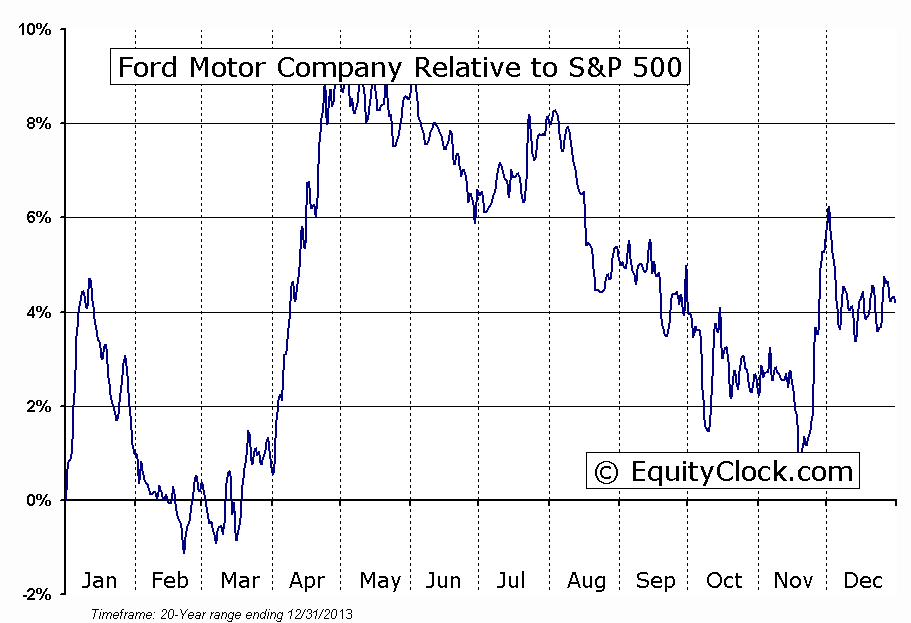
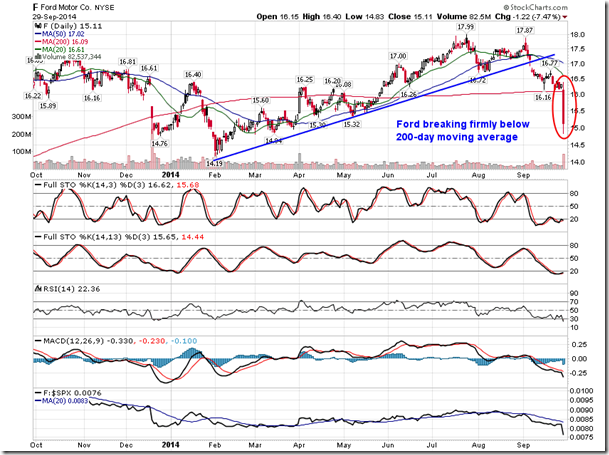
Notable activity was recorded in shares of Ford Motor Company (NYSE:F) on Monday as the stock plunged 7.47% following a cut in the company’s full-year profit forecast. The stock broke firmly below its 200-day moving average, now trading around the lows of the year. The stock began underperforming the market in early August, following its average seasonal pattern that call for relative weakness through to November. Momentum indicators are deeply oversold, but have yet to show signs of bottoming. The stock traded to a low of $14.83 during Monday’s session, testing a level of support presented by the March low; next level of support can be found at the February low of $14.19, below which levels of support in the $12 range would have to be referenced. The stock broke trendline support just this month, suggesting downside potential ahead. The period of seasonal strength for Ford runs from March through to May during what is typically known as the spring automobile buying season.
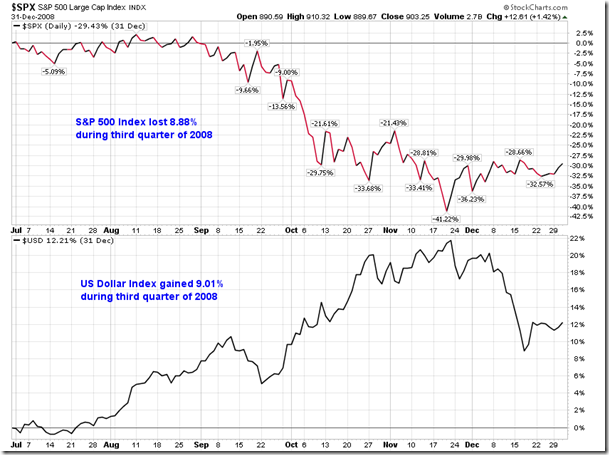
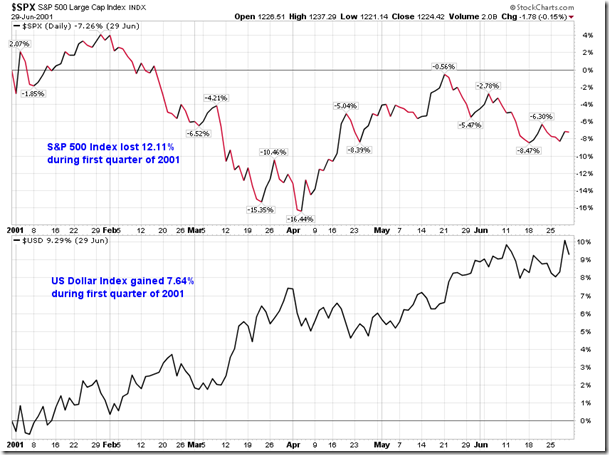
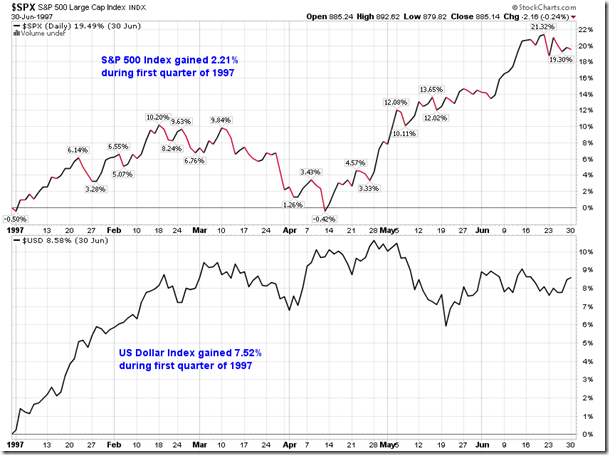
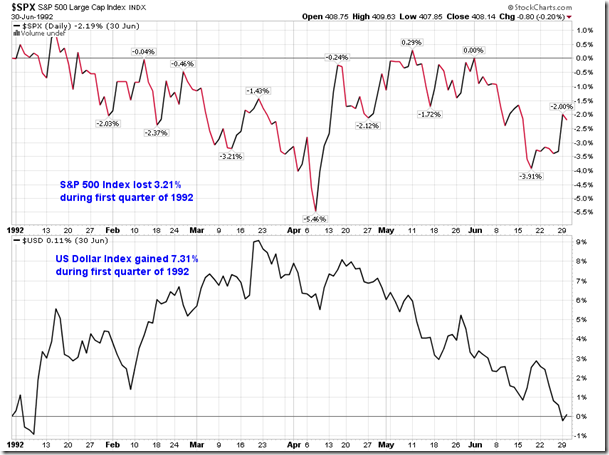
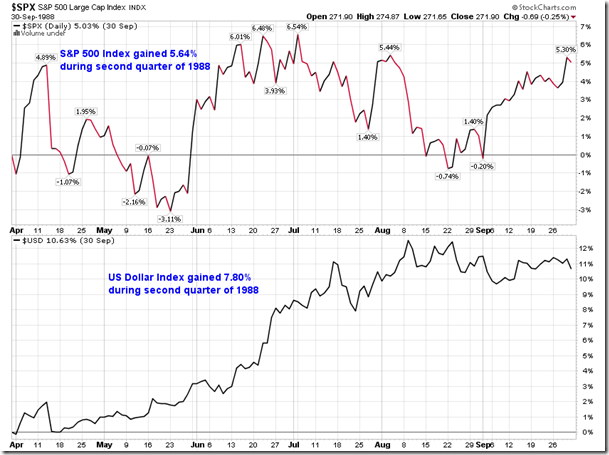
Today marks the end of the third quarter and investors will be anxiously waiting to confirm whether or not the S&P 500 can realize a 7th consecutive quarterly gain. The benchmark is presently up by 0.90% since the quarter began, although the index has flirted with negative territory over recent sessions. As for the US Dollar Index, it seems certain that the currency benchmark will close the quarter with a solid gain; the index is higher by 7.43% as of Monday’s close. This is the strongest quarterly gain for the currency benchmark since the third quarter of 2008 when the index gained 9.01%. Dollar strength during that quarter coincided with equity market weakness as the S&P 500 plunged 8.88%; the quarter that followed didn’t fare much better with the large-cap index falling 22.45% from the start of October through to the end of December of 2008. Quarterly gains in the US Dollar index between 7% to 10% have coincided with shaky equity market performance over the past 28 years, as shown in the charts below; 3 out of 5 instances have seen substantial losses in the S&P 500 Index, emphasizing the inverse correlation the US Dollar index often has with the equity market. The true weight of the stronger US Dollar should become apparent into October as companies begin to report earnings from the quarter just past.
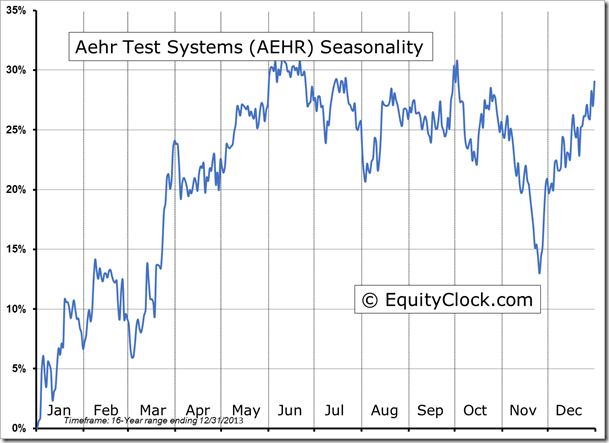
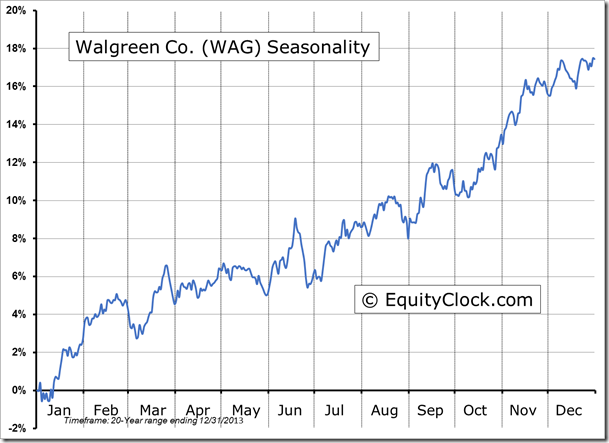
Seasonal charts of companies reporting earnings today:
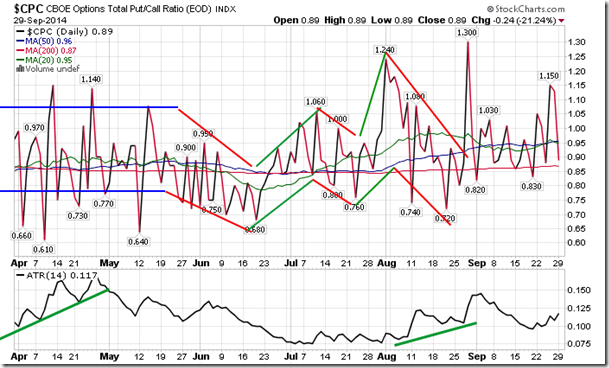
Sentiment on Monday, as gauged by the put-call ratio, ended bullish at 0.89.
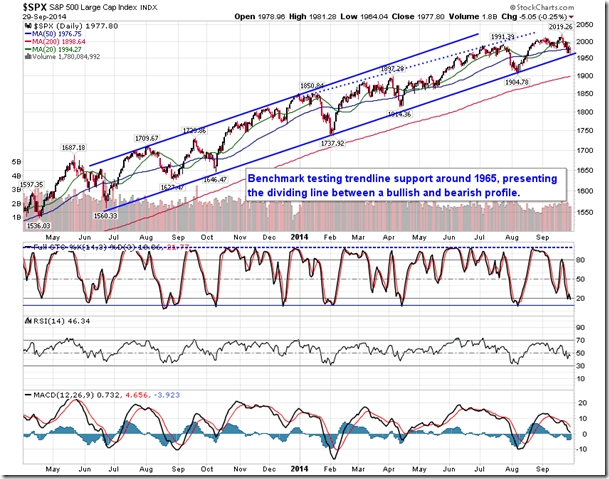
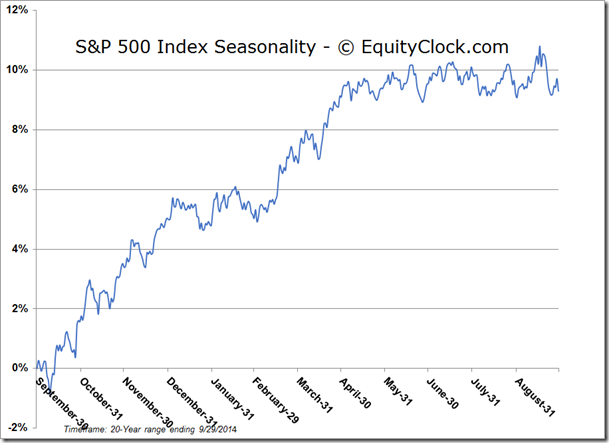
S&P 500 Index
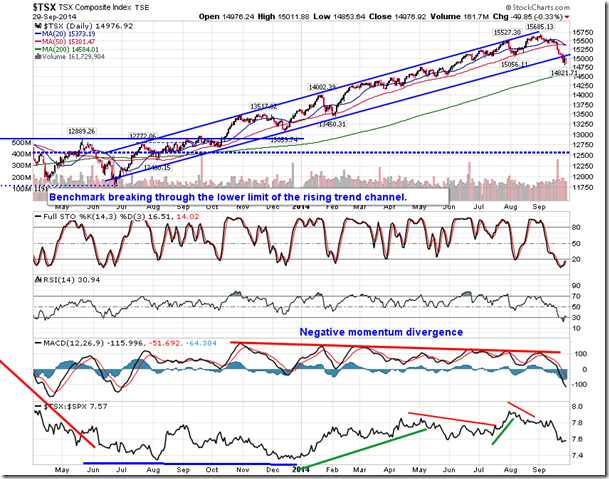
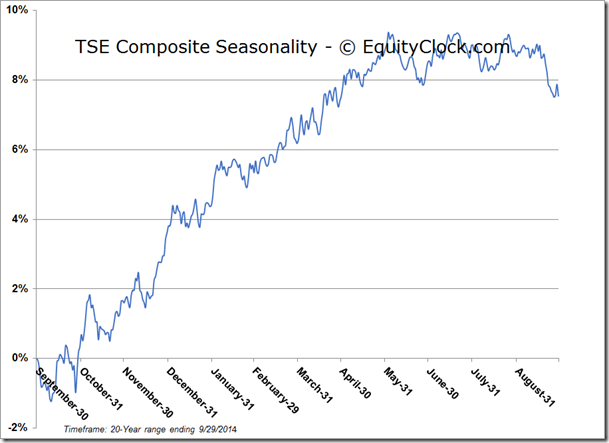
TSE Composite
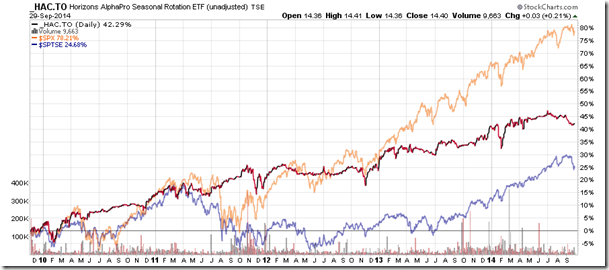
Horizons Seasonal Rotation ETF (TSX:HAC)
- Closing Market Value: $14.40 (up 0.21%)
- Closing NAV/Unit: $14.39 (up 0.09%)
Performance*
| 2014 Year-to-Date | Since Inception (Nov 19, 2009) | |
| HAC.TO | 0.63% | 43.9% |
performance calculated on Closing NAV/Unit as provided by custodian
