Upcoming US Events for Today:
- PPI for June will be released at 8:30am. The market expects a month-over-month increase of 0.3% versus a decline of 0.2% previous. Less Food and Energy, the increase is expected to show 0.2% versus a decline of 0.1% previous.
- Industrial Production for June will be released at 9:15am. The market expects a month-over-month increase of 0.45 versus an increase of 0.6% previous. Capacity Utilization is expected to show 79.2% versus 79.1% previous.
- Housing Market Index for July will be released at 10:00am. The market expects 51 versus 49 previous.
- Janet Yellen delivers her semi-annual monetary policy testimony to House Financial Services Committee at 10:00am.
- Weekly Crude Inventories will be released at 10:30am.
- Fed’s Beige Book will be released at 2:00pm.
Upcoming International Events for Today:
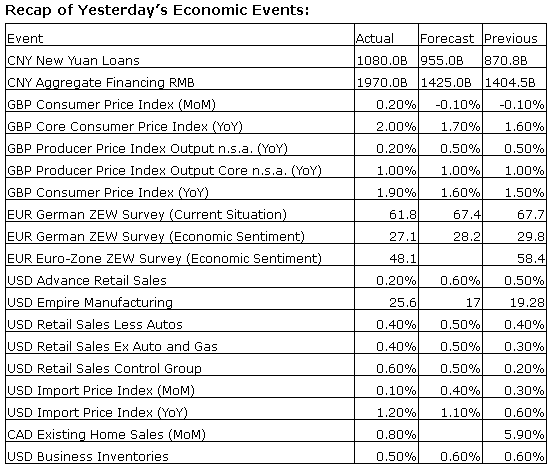
- Great Britain Labour Market Report for June will be released at 4:30am EST. The market expects the Claimant Count to decline by 26,500 versus a decline of 27,400 previous.The Unemployment Rate is expected to dip to 6.5% versus 6.6% previous.
- Euro-Zone Merchandise Trade for May will be released at 5:00am EST. The market expects €16.5B versus €15.7B previous
- Canadian Manufacturing Sales for May will be released at 8:30am EST. The market expects a month-over-month increase of 1.3% versus a decline of 0.1% previous.
- Bank of Canada Announcement will be delivered at 10:00am EST. The market expects no change in rates at 1.0%.
The Markets
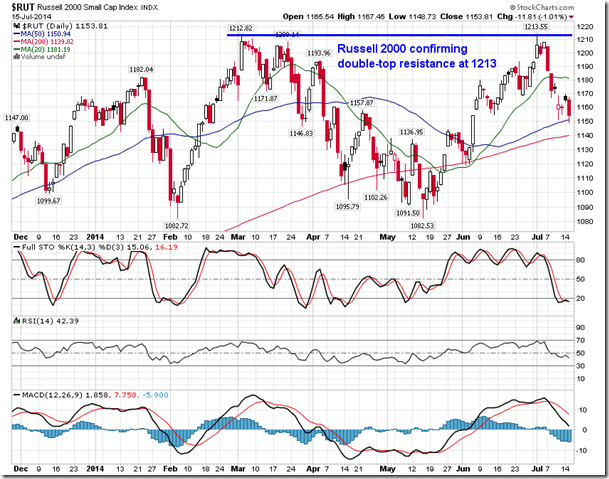
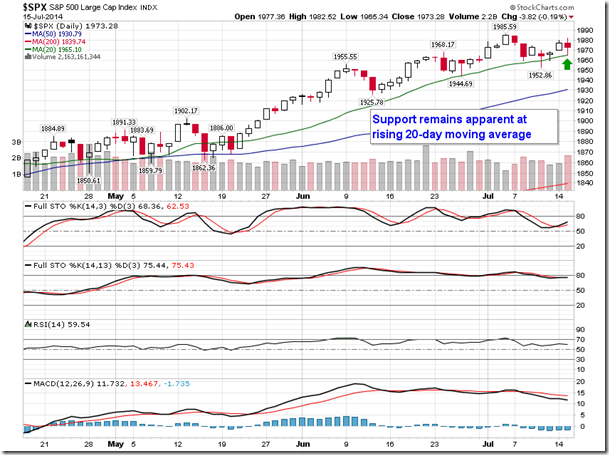
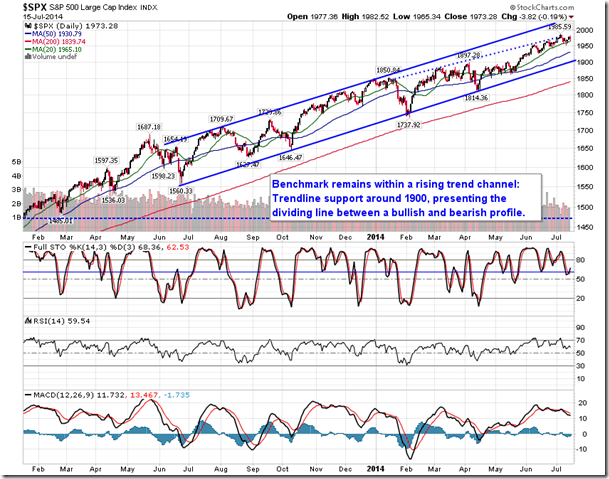
Stocks ended slightly lower on Tuesday as investors reacted to statements from Fed Chair Yellen. Commenting on the valuation of equity markets, the central bank chief noted that “metrics in some sectors do appear substantially stretched—particularly those for smaller firms in the social media and biotechnology industries.” Stocks dipped lower following this statement, particularly in the social media and biotechnology spaces, which weighed more heavily on the NASDAQ Composite. The Small-Cap Russell 2000 also recorded a decline of over 1% as the benchmark continues to confirm the recent double-top resistance charted at the start of the month. Losses earlier in the session were quickly contained as major equity benchmarks, such as the Dow Jones Industrial Average and S&P 500, tested support at their 20-day moving average lines. Janet Yellen will testify before congress today at 10:00am.
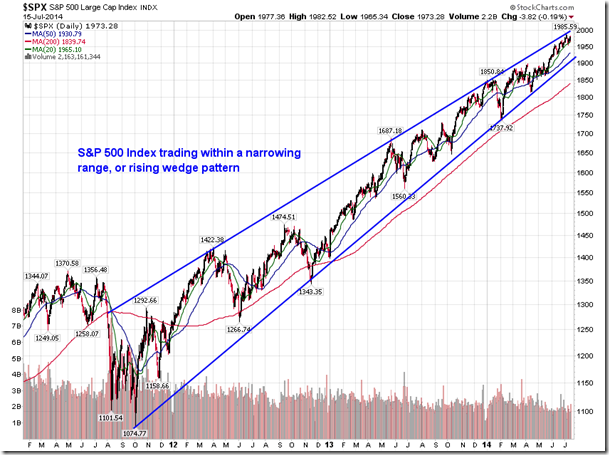
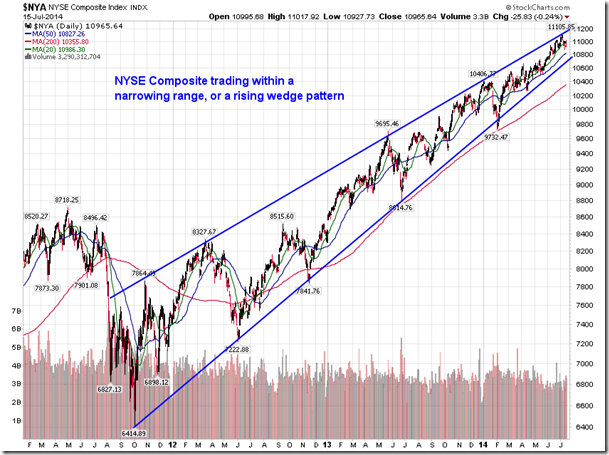
Stocks have come a long way since the last major correction in the summer of 2011. The S&P 500 Index has almost doubled, trading from a low of 1075 to present levels close to 2000. Over the past three years, US equity benchmarks, including the S&P 500 Index and NYSE Composite, have been trading within a narrowing range, also known as a rising wedge pattern. The benchmarks are reaching the peak of this setup, which typically has bearish implications should price trade below the lower limit of the formation. There is no telling when the benchmark may break out of this narrowing range, however, the resulting move could be significant given the magnitude of the setup. Price is currently hovering around the upper limit of the range with the lower limit around 1900.
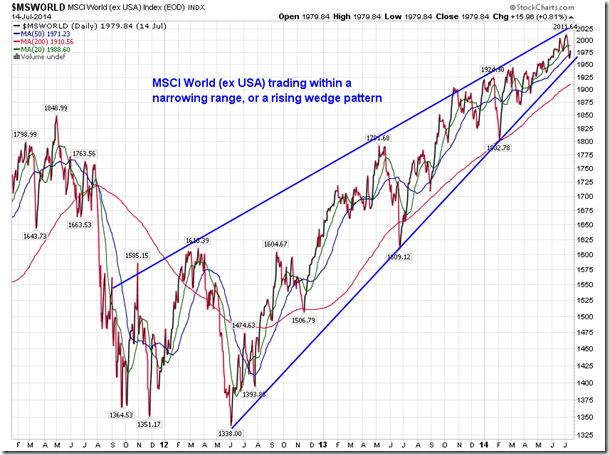
Benchmarks outside of the US do not appear immune from this potentially negative setup. The MSCI World ex US Index is showing a similar pattern, in this case stemming back to the lows charted in June of 2012. For now, the patterns warrant monitoring given the support and resistance characteristics they present, but reason to become negative on stocks is not there just yet.
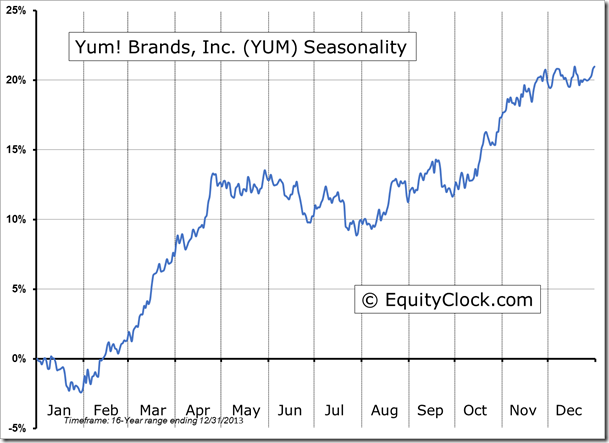
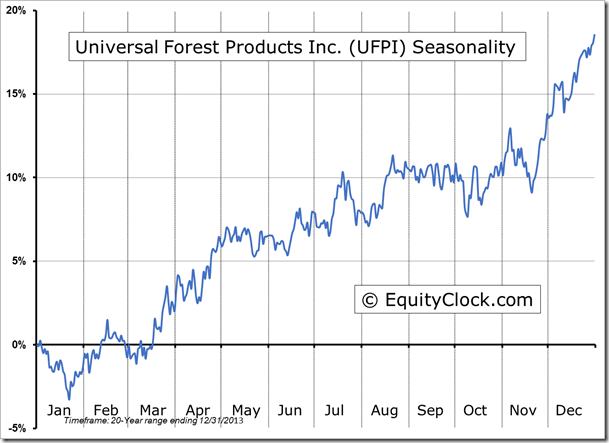
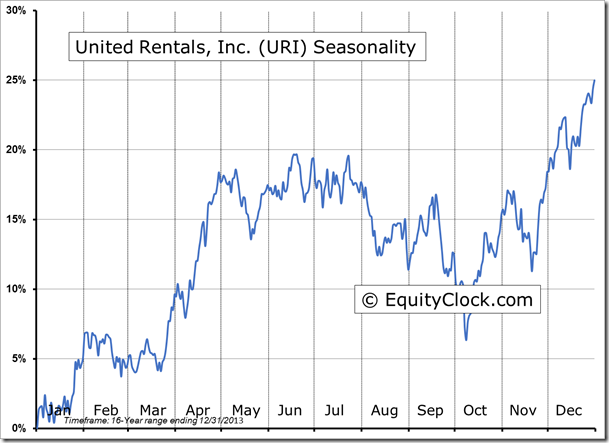
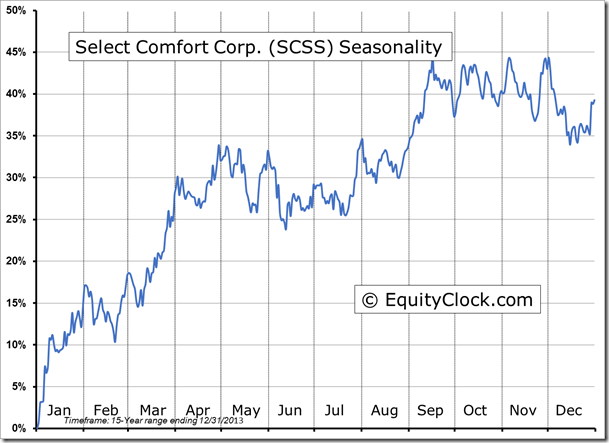
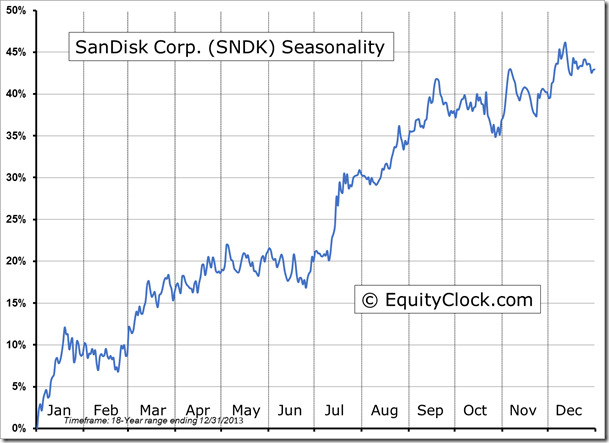
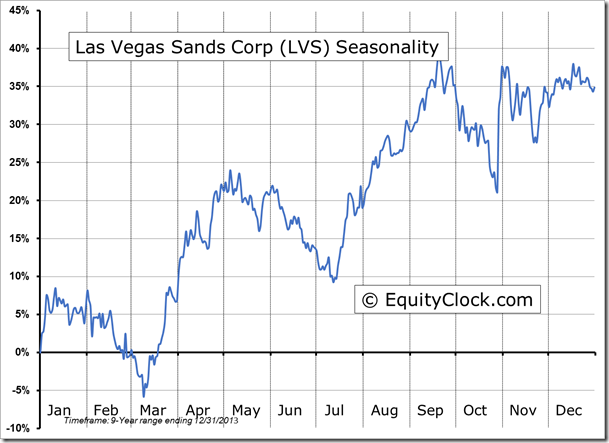
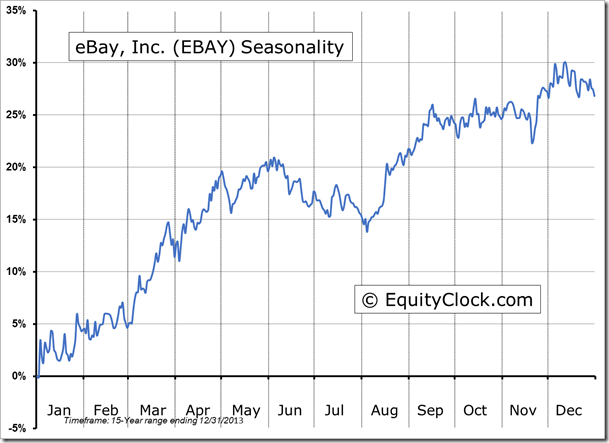
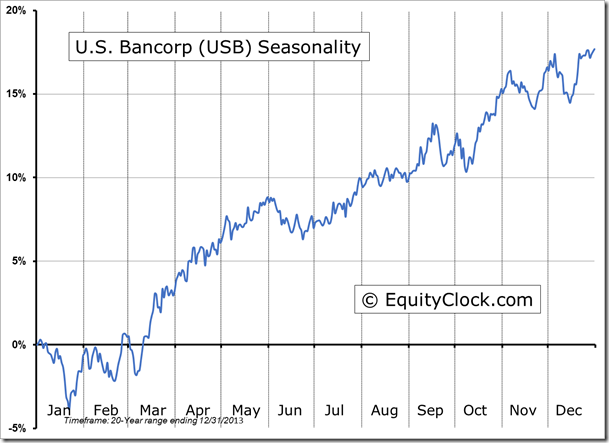
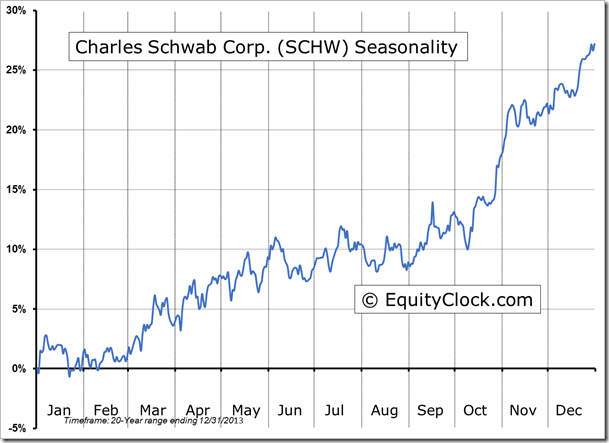
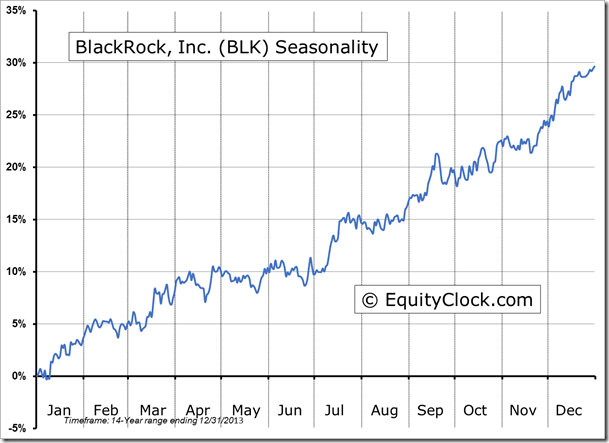
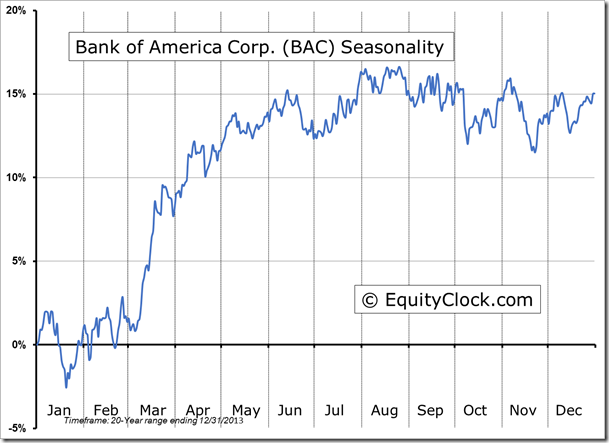
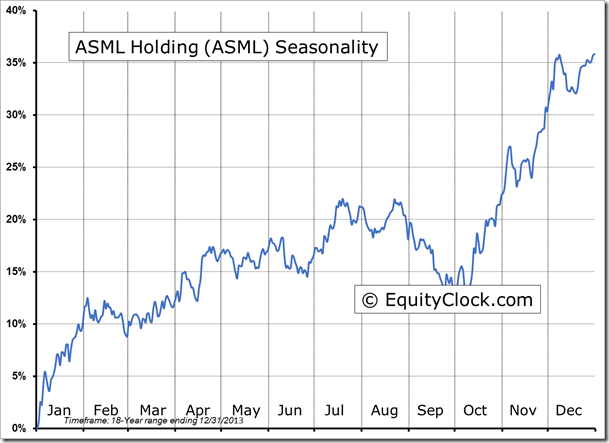
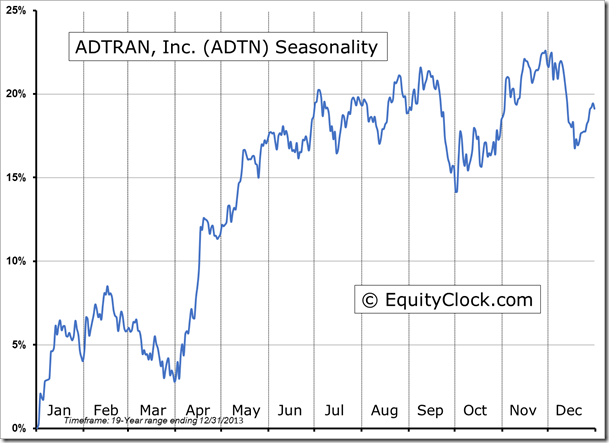
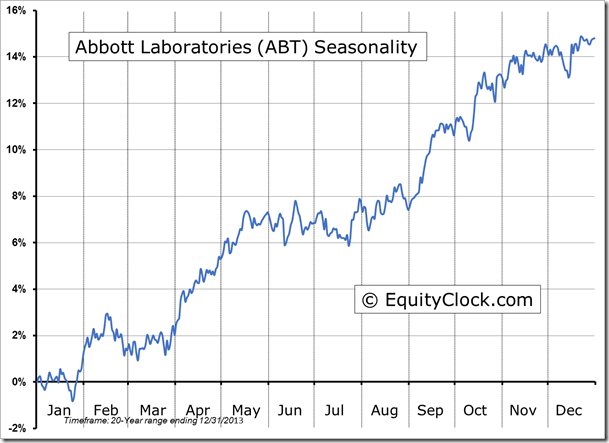
Seasonal charts of companies reporting earnings today:
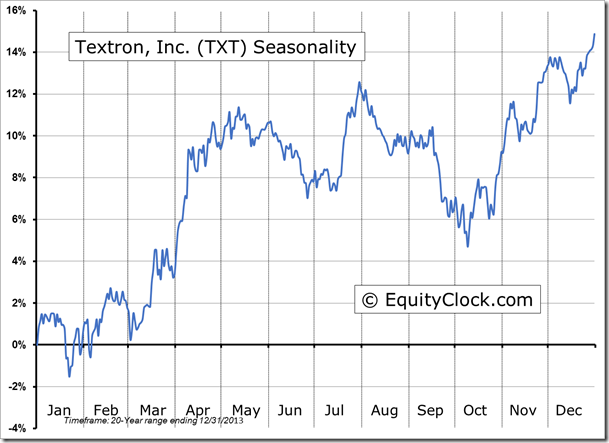
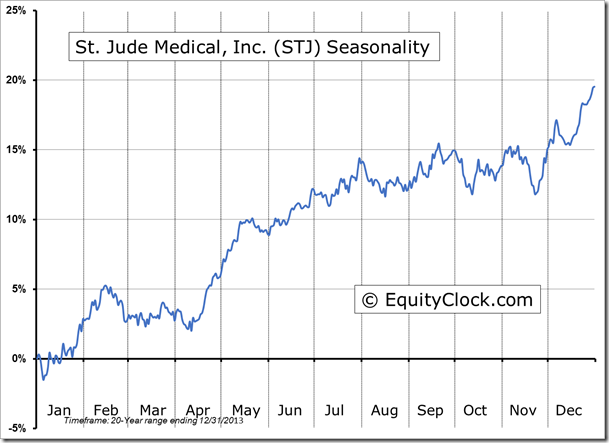
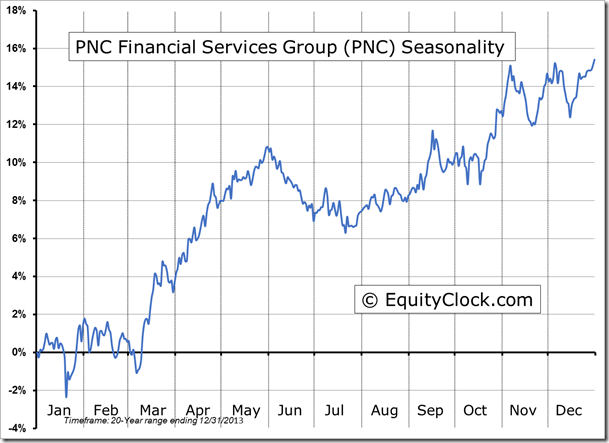
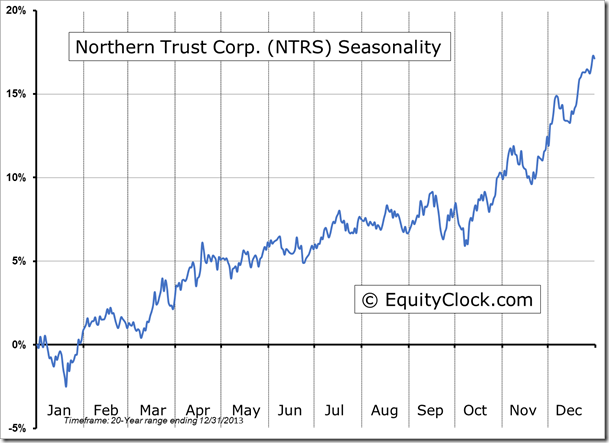
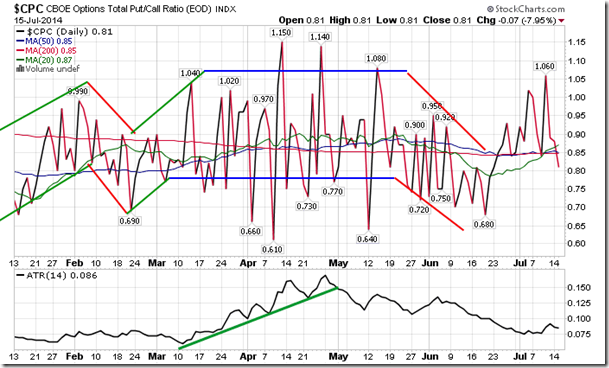
Sentiment on Tuesday, as gauged by the put-call ratio, ended bullish at 0.81.
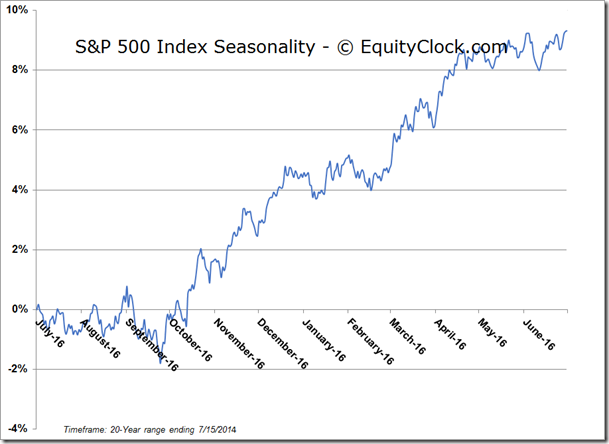
S&P 500 Index
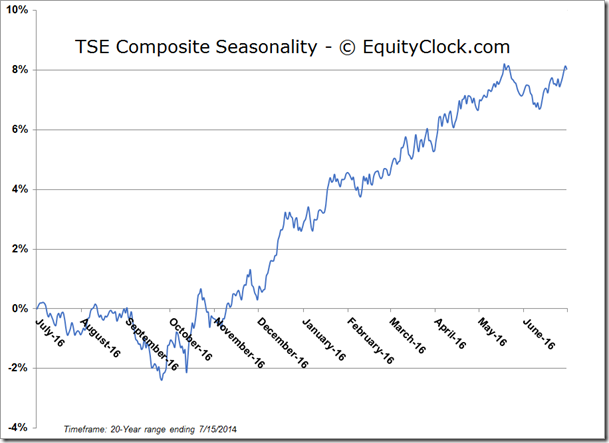
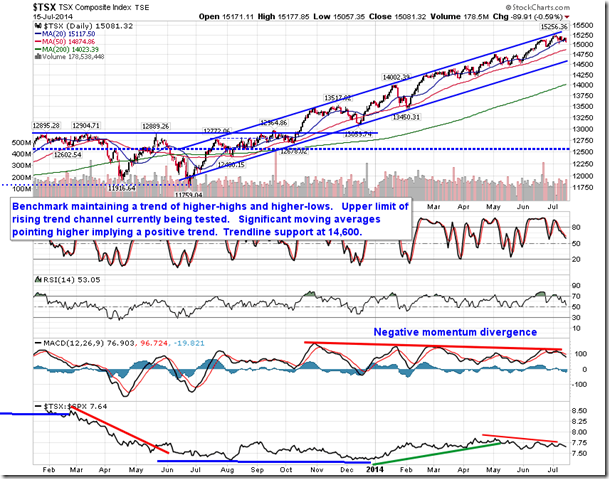
TSE Composite
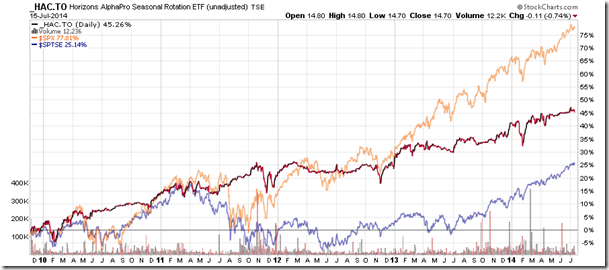
Horizons Seasonal Rotation ETF (TSX:HAC)
- Closing Market Value: $14.70 (down 0.74%)
- Closing NAV/Unit: $14.70 (down 0.56%)
Performance*
| 2014 Year-to-Date | Since Inception (Nov 19, 2009) | |
| HAC.TO | 2.80% | 47.0% |
* performance calculated on Closing NAV/Unit as provided by custodian
