
**NEW** As part of the ongoing process to offer new and up-to-date information regarding seasonal and technical investing, we are adding a section to the daily reports that details the stocks that are entering their period of seasonal strength, based on average historical start dates. Stocks highlighted are for information purposes only and should not be considered as advice to purchase or to sell mentioned securities. As always, the use of technical and fundamental analysis is encouraged in order to fine tune entry and exit points to average seasonal trends.
Stocks Entering Period of Seasonal Strength Today:
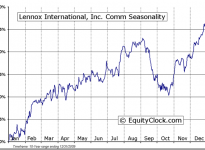
Lennox International Inc. (NYSE:LII) Seasonal Chart
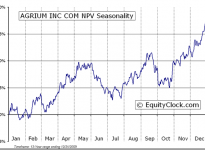
Agrium Inc. (NYSE:AGU) Seasonal Chart
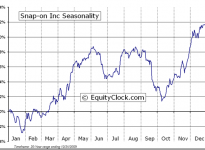
Snap-on Incorporated (NYSE:SNA) Seasonal Chart
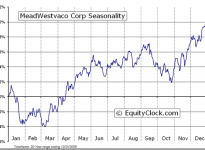
MeadWestvaco Corp. (NYSE:MWV) Seasonal Chart
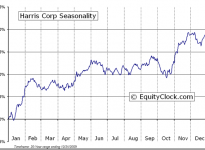
Harris Corporation (NYSE:HRS) Seasonal Chart
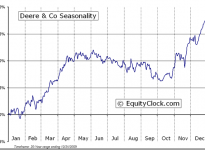
Deere & Company (NYSE:DE) Seasonal Chart
The Markets
Stocks sold off on Wednesday as the shooting of a Canadian soldier in Ottawa spooked investors who became concerned of further coordinated attacks on either Canadian or American soil.The TSX Composite plunged around 1.6%, resisting from a declining 20-day moving average and charting an outside reversal candlestick that encompassed the previous day’s trading range. Despite the recent oversold bounce, the trend of the Canadian market remains negative on both a short and intermediate basis, as indicated by the direction of the 20 and 50-day moving averages. The TSX broke below a significant long-term rising trend channel at the end of September as the plunge in oil prices acted as a detriment for energy stocks; until a bottoming pattern is realized, the newly formed negative trend must be assumed to continue. Canadian stocks continue to underperform US counterparts, a trend that is seasonally typical through to mid-December as energy stocks remain out of favour following seasonal strength in the front half of the year.


Much of the same can be said for American equity benchmarks, which broke below their long-term rising trends at the end of September. The 20 and 50-day moving averages of major US equity benchmarks, including the S&P 500 Index, NYSE Composite, and Russell 2000 Index, continue to point lower, implying negative short and intermediate-term trends. A trend of lower-lows and lower-highs can be assumed. The S&P 500 recently bounced from a level of support around 1815, a break of which would lead to a retest of the February low around 1737. Investors in the US continue to battle with the fact that the Fed will be withdrawing monetary stimulus by the end of the month, an event that has previously led to equity market declines of up to 20%, as realized following the conclusion of QE1 and QE2. Should this pattern play out again, stocks may be only in the early innings of a more prolonged decline. Equity markets enter their seasonally strong period at the end of October, on average, therefore any weakness between now and the end of November may lead to ideal buying opportunities for the period of seasonal strength ahead.

Emphasising the risk averse nature of Wednesday’s trade was the outperformance of the Consumer Staples and Utilities sectors, two defensive areas of the market that finished the day positive amidst declines in all other equity sectors. The Utilities Sector ETF (SPDR Select Sector - Utilities (NYSE:XLU)) charted a new all-time high during Wednesday’s session, while the Consumer Staples Sector ETF (SPDR - Consumer Staples (ARCA:XLP)) remains a mere six-tenths of a percent off of the all-time closing high. Coming into the winter season, utility stocks, particularly those relating to electric utilities, can continue to perform well through to the end of the year. Gains in the sector tend to be weather dependent where colder than expected weather results in stronger returns.The 2015 Farmer’s Almanac is forecasting a colder and wetter than normal winter with the coldest periods expected in late-December and early January. The S&P 500 Electric Utilities Subindustry Index has strongly outperformed the market since the end of September, benefiting from the risk aversion that has been prevalent for the past month.


Sentiment on Wednesday, as gauged by the put-call ratio, ended bearish at 1.14.The Average True Range (ATR) of the ratio remains elevated, suggesting volatile trading, typically a scenario that coincides with broad market weakness. Declines in the ATR, implying a return to a more normal trading environment, would likely lead to the start of the next up-leg in equity market indices. Volatility seasonally peaks in the month of October, on average.

Sectors and Industries entering their period of seasonal strength:


The Metals & Mining Industry enters its period of seasonal strength today, gaining, on average, through the end of the year. Gains over the past 20 years have averaged around 7%, benefiting from positive tendencies pertaining to manufacturing following a summer slowdown.The Metals & Mining ETF (XME) has significantly underperformed the market since mid-August, following the familiar weak seasonal pattern; the trend on a short and intermediate timescale remains negative. The ETF recently tested support around $31.40 after trading to the most oversold level in the fund’s history, according to the Relative Strength Index (RSI). The industry ETF has yet to carve out a bottoming pattern following the recent decline, suggesting that the door to the period of seasonal strength may not yet be open, even though the average seasonal date has been crossed; a higher short or intermediate low above the recent low of $31.41 is required to suggest a change of trend. A break below the apparent level of support could lead to a retest of the 2009 lows between $19 and $20 as the industry continues to struggle to recoup the losses from the 2008-2009 plunge.

Seasonal charts of companies reporting earnings today:


S&P 500 Index


TSE Composite


Horizons Seasonal Rotation ETF (TO:HAC)
- Closing Market Value: $14.24 (up 0.14%)
- Closing NAV/Unit: $14.24 (up 0.07%)
Performance*
| 2014 Year-to-Date | Since Inception (Nov 19, 2009) | |
| HAC.TO | -0.42% | 42.4% |
* performance calculated on Closing NAV/Unit as provided by custodian
