
**NEW** As part of the ongoing process to offer new and up-to-date information regarding seasonal and technical investing, we are adding a section to the daily reports that details the stocks that are entering their period of seasonal strength, based on average historical start dates. Stocks highlighted are for information purposes only and should not be considered as advice to purchase or to sell mentioned securities. As always, the use of technical and fundamental analysis is encouraged in order to fine tune entry and exit points to average seasonal trends.
Stocks Entering Period of Seasonal Strength Today:
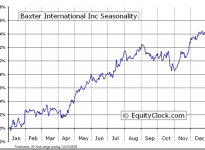
Baxter International Inc. (NYSE:BAX) Seasonal Chart
The Markets
Stocks gained on Wednesday as investors welcomed the change in leadership of the Senate following Tuesday’s Republican victory. Investors are betting that the Republican majority in the House and now the Senate will be more business friendly, fuelling optimism in equity markets. The S&P 500 Index and Dow Jones Industrial Average broke to new closing highs as US benchmarks attempt to chart a new rising trend. Strength across the sectors was fairly broad based, however, the utilities sector topped the leaderboard as the market segment continues to chart a near parabolic move following the lows charted in August. Although typically weak in the month of November, Utilities remain seasonally positive into the end of the year as investors speculate on the upcoming winter weather. History suggests that Electric Utilities tend to perform best when investors anticipate colder than average winter weather, a bet on higher usage and greater revenues from companies in this industry. The S&P 500 Electric Utilities SubIndustry Index gained 2.34%, charting the highest level since 2008.


The Republican win not only gave a boost to equity prices, but the US Dollar strengthened as well. The US Dollar Index is now trading at the highest level since the end of QE1 in 2010, moving in on resistance at 89. The US Dollar Index continues to chart a long-term basing pattern, suggesting a stronger US Dollar remains likely over the years to come. Coincidentally, the last bull market in the US Dollar Index was from 1995 through 2000 as the Republicans held a majority in the House and the Senate and a Democrat was in the White House. The Dollar strength in the second half of the 90’s pressured commodity prices lower by around 21%, according to the CRB Commodity Index, during the five year period; material stocks suffered as a result. The US Dollar Index seasonally strengthens in the month of November, followed by strength through the first quarter of the year.

 Seasonal Chart")
With the stronger dollar, metal prices took a hit, including significant declines in Silver and Palladium. Silver has shed nearly 70% of its value since peaking in 2011, charting a long-term trend of lower-highs and lower-lows in the process. The commodity is now testing an important multi-year rising trendline that stretches back to the turn of the century, perhaps the one last line in the sand maintaining some resemblance of bullishness in the longer-term direction of the metal. Silver has also posted significant declines relative to the price of Gold over the last few years, but the relative value of the precious metal is quickly approaching long-term support. This suggests that the relative trend may be close to shifting in favour of Silver, replacing its more defensive counterpart. The price of Silver relative to Gold enters into a period of seasonal strength around this time of year, accelerating into the first quarter of the new year. Keep in mind that even though these apparent ultra-long-term levels of support look enticing, the declining trend stemming from the 2011 peak continues to hold precedent, suggesting a declining path until some type of bottoming pattern is recorded; the ongoing rise in the US Dollar will continue to pose a threat to the trade for some time to come.


Sentiment on Wednesday, according to the put-call ratio, ended bullish at 0.89.

Seasonal charts of companies reporting earnings today:


S&P 500 Index


TSE Composite


Horizons Seasonal Rotation ETF (TO:HAC)
- Closing Market Value: $14.71 (up 0.62%)
- Closing NAV/Unit: $14.71 (up 0.40%)
Performance*
| 2014 Year-to-Date | Since Inception (Nov 19, 2009) | |
| HAC.TO | 2.87% | 47.1% |
* performance calculated on Closing NAV/Unit as provided by custodian

Sponsored By...