Upcoming US Events for Today:
- Weekly Jobless Claims will be released at 8:30am. The market expects Initial Claims to show 310K versus 302K previous.
- Flash Manufacturing PMI for July will be released at 9:45am. The market expects 57.6 versus 57.5 previous.
- New Home Sales for June will be released at 10:00am. The market expects 475K versus 504K previous.
- Kansas City Fed Manufacturing Index for July will be released at 11:00am. The market expects 6, consistent with the previous report.
Upcoming International Events for Today:
- German Flash Manufacturing PMI for July will be released at 3:30am EST. The market expects 51.8 versus 52.4 previous.
- Euro-Zone Flash Manufacturing PMI for July will be released at 4:00am EST. The market expects 51.7 versus 51.9 previous.
- Great Britain Retail Sales for June will be released at 4:30am EST. The market expects a year-over-year increase of 3.8% versus an increase of 3.9% previous.
- Japan CPI for June will be released at 7:30pm EST. Excluding Food, the market expects a year-over-year increase of 3.3% versus an increase of 3.4% previous.
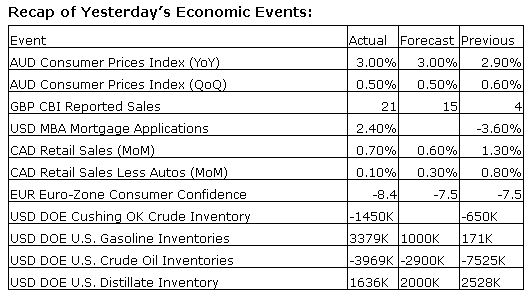
The Markets
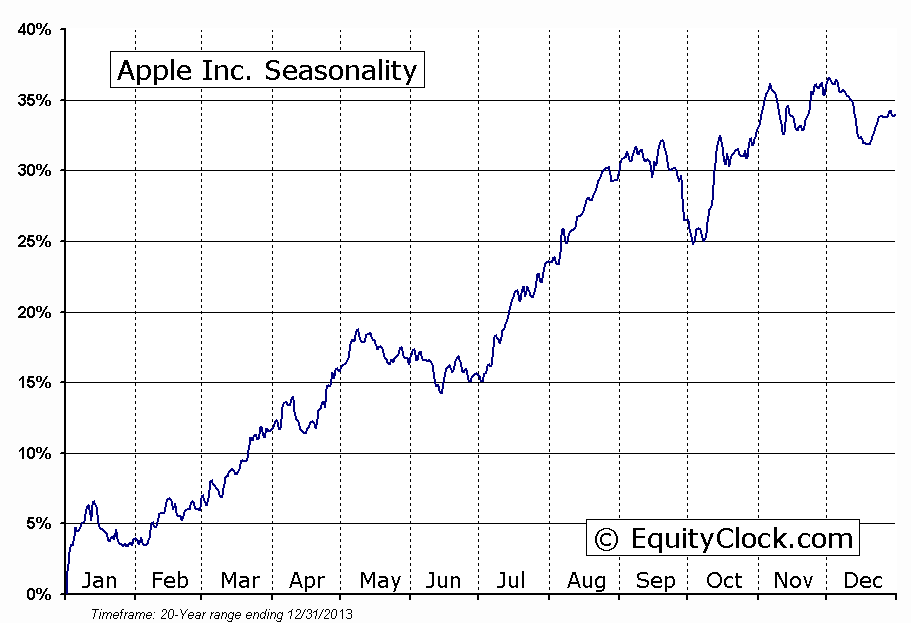
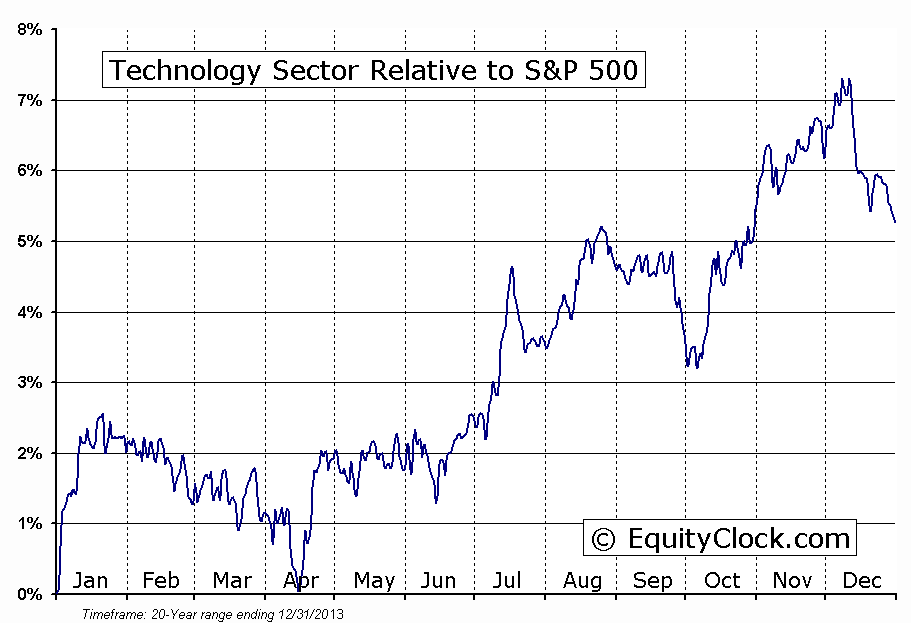
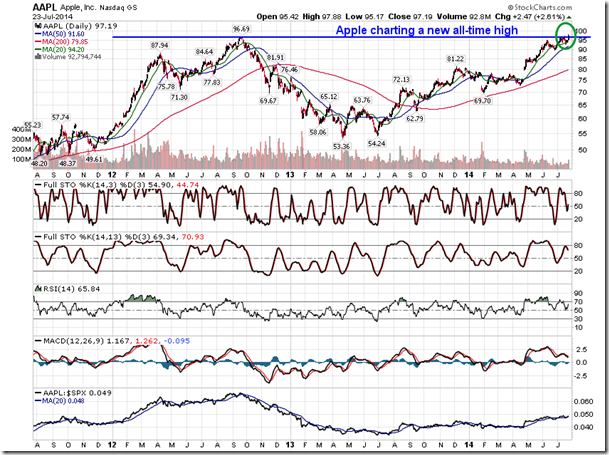
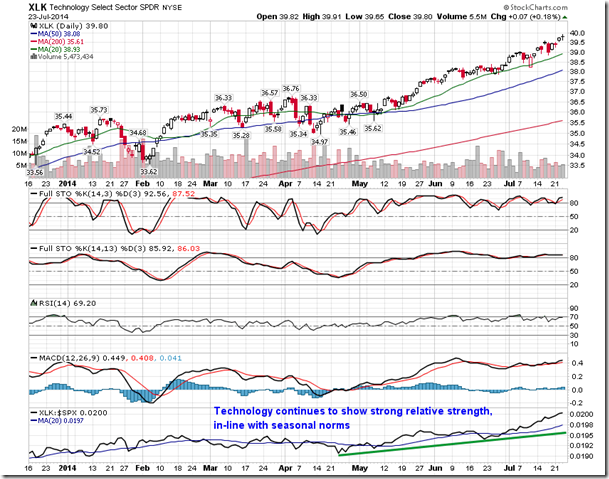
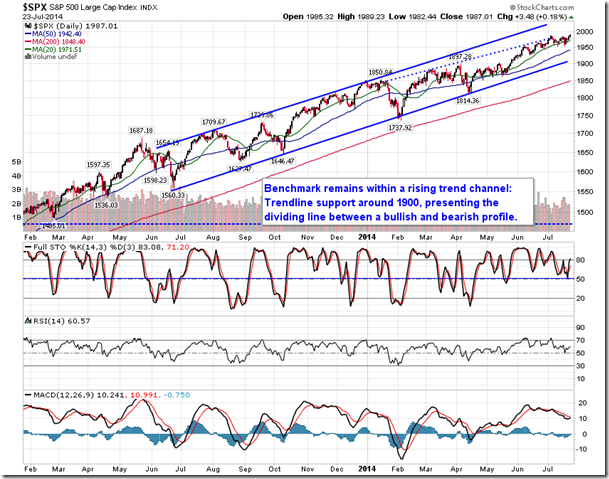
Stocks ended higher on Wednesday, pushing the S&P 500 Index to a new all-time closing high. Strength in shares of Apple (NASDAQ:AAPL), which closed at a new all-time high itself, was among the factors influencing broad market benchmarks higher on the day. Apple’s better than expected earnings acted as a catalyst for the positive trading activity during Wednesday’s session as investors became optimistic of upcoming product releases, such as the iPhone 6. Shares of AAPL typically trade higher into their September product released dates, following which investors commonly book profits ahead of the Christmas buying season. Technology has been the best performing sector since mid-April, in part due to strength in shares Apple, a trend that is in-line with seasonal averages during the second and third quarters. The sector reaches a seasonal peak for the third quarter in the month of August.
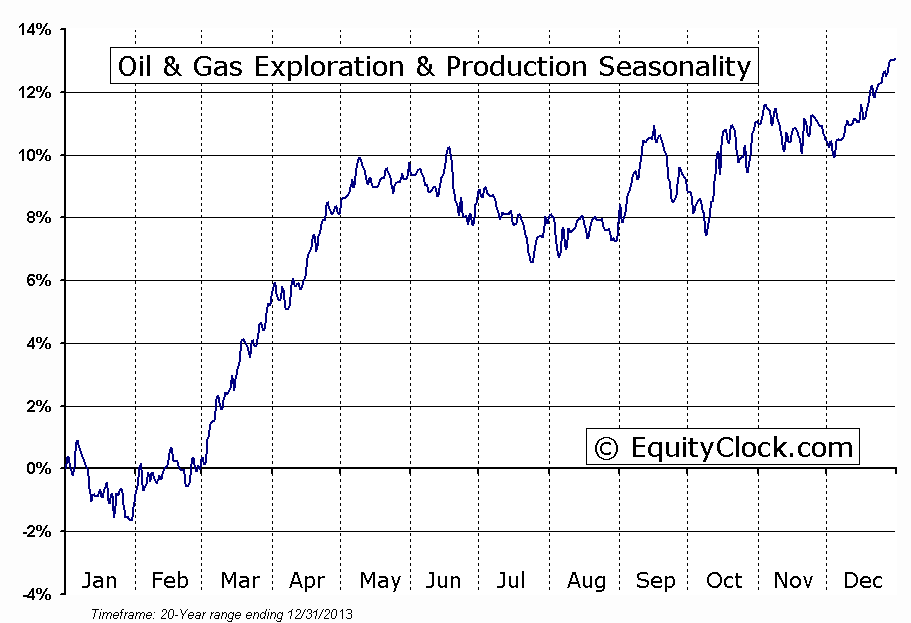
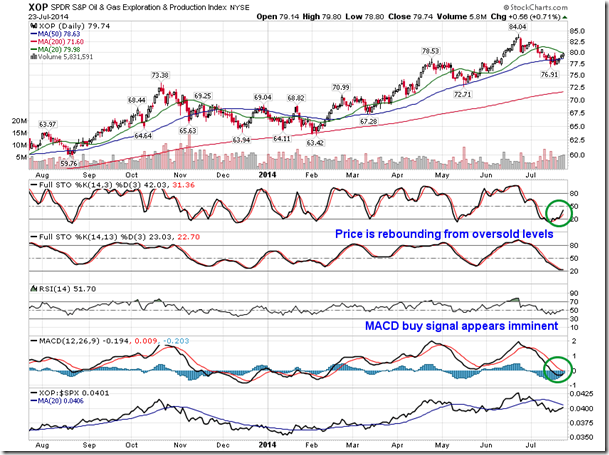
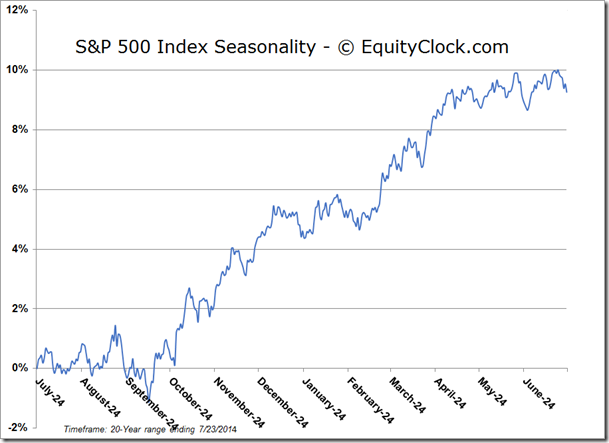
The summer months are generally a time to stay away from cyclical equity sectors, particularly Industrials, Materials, and Consumer Discretionary, due to their vulnerability to rising seasonal volatility that persists through to October. Since June, Industrials and Materials have underperformed the broad market, while Discretionary has performed on par with the the S&P 500. Still, seasonal opportunities in cyclical equities exist through this typically volatile period. One of these cyclical areas is Oil and Gas Exploration and Production, which is about to enter a period of seasonal strength that spans from the end of July through to September. The industry has gained an average of 4% over the past 20 years, “fuelled” by strong oil prices through to the Labour Day long weekend. The Oil & Gas Exploration ETF (NYSE:XOP) is presently attempting to rebound from oversold levels; a MACD buy signal appears imminent. The summer trade in the energy sector is the second seasonal run of the year, the first occurring from January through to May, which is typically the more prominent trade of the two. Energy has been one of the strongest sectors this year and there is no reason, as of yet, that this strength is about to end.
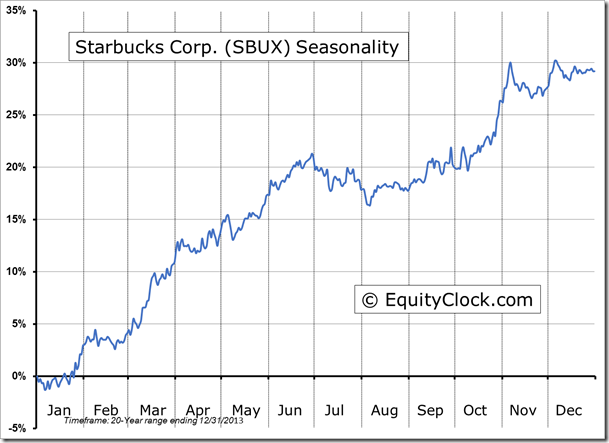
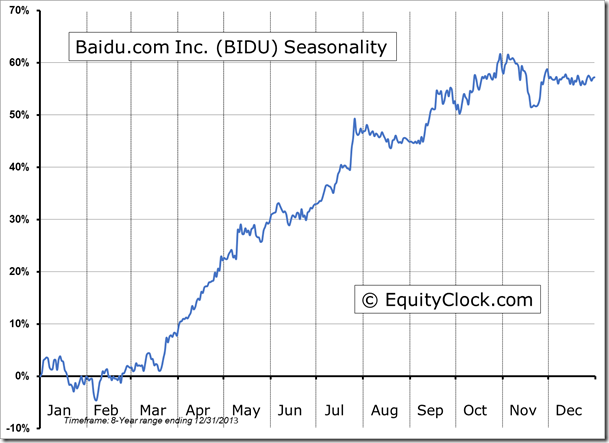
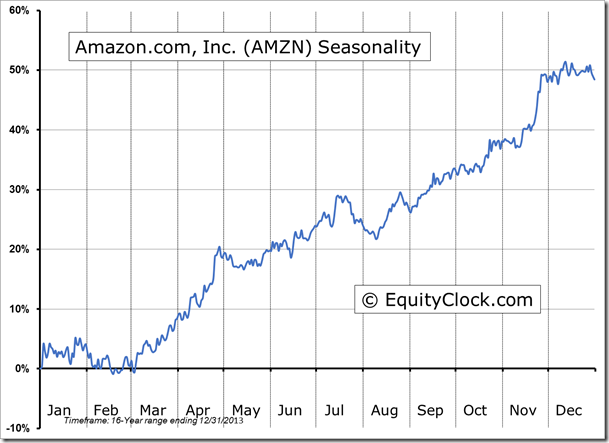
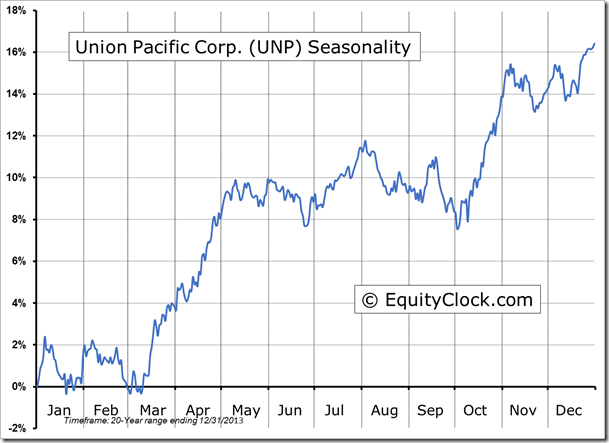
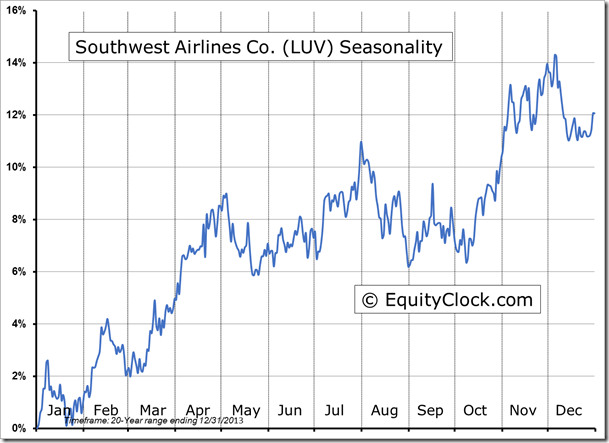
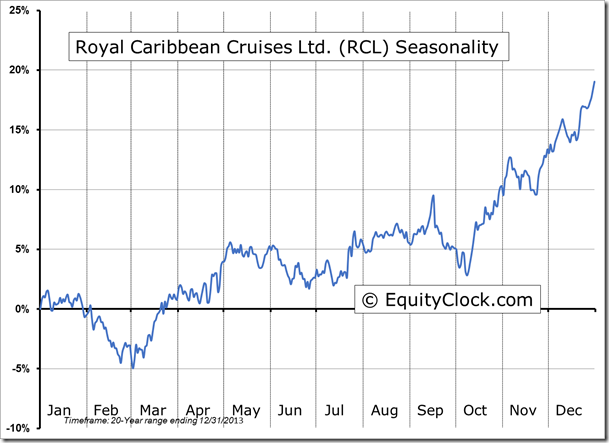
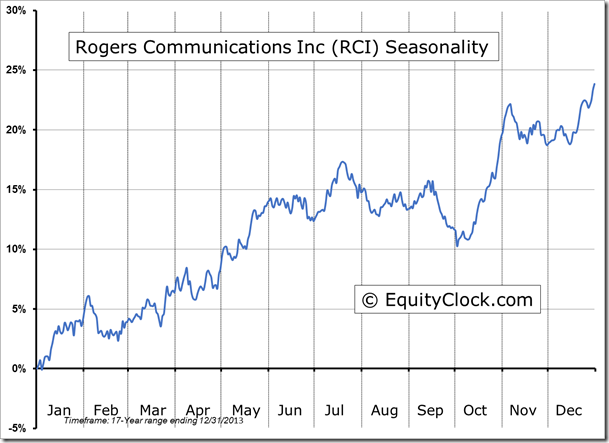
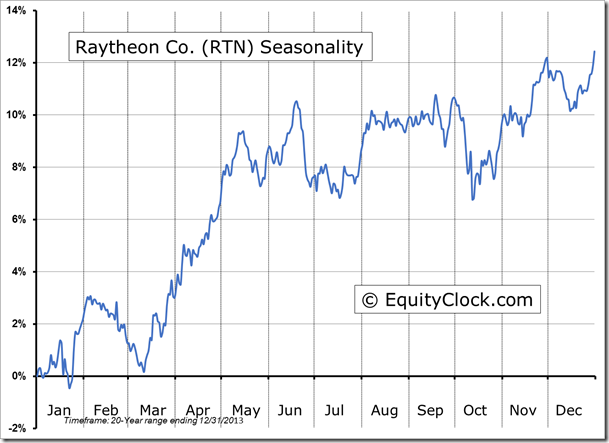
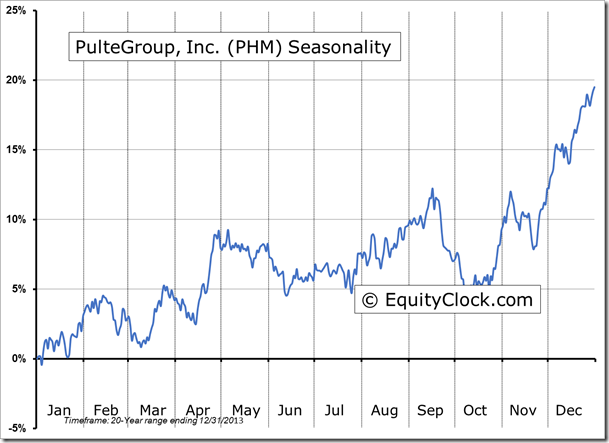
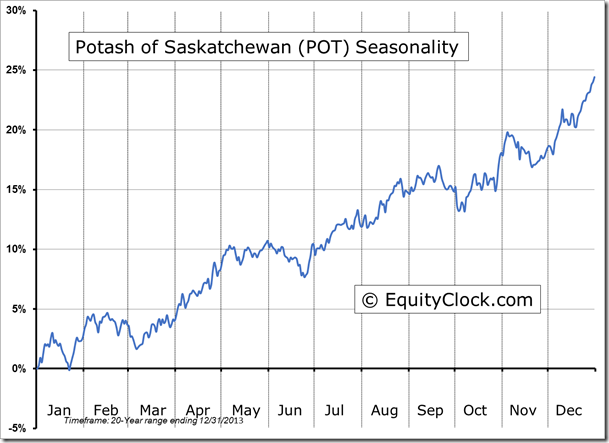
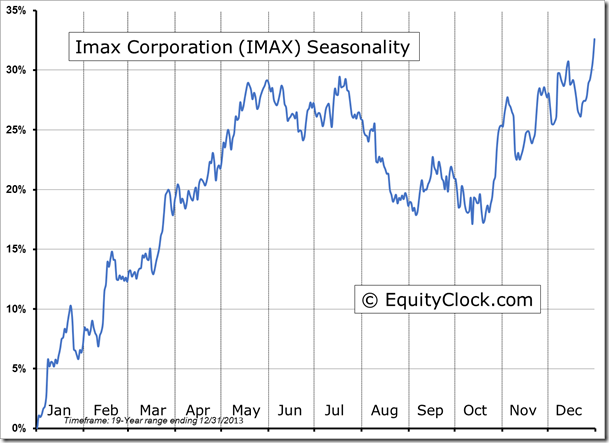
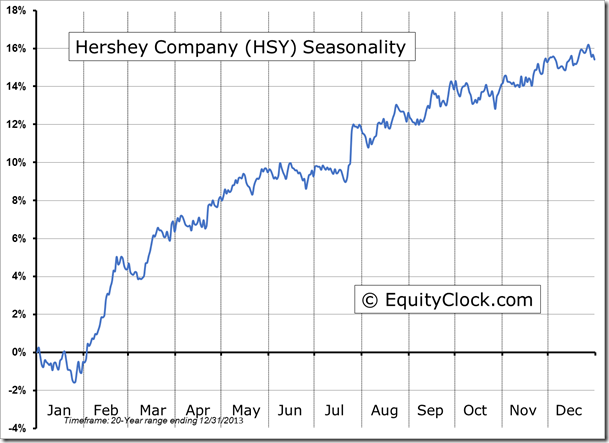
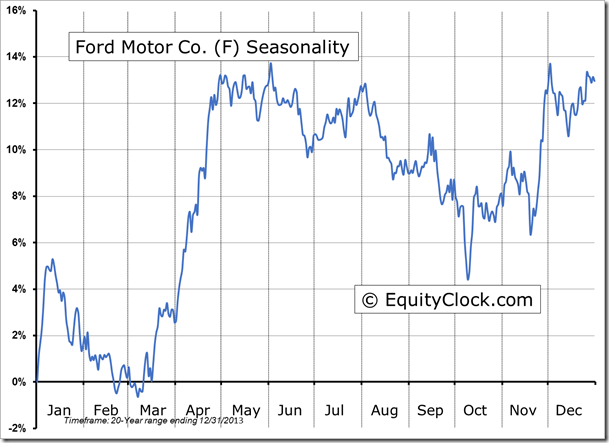
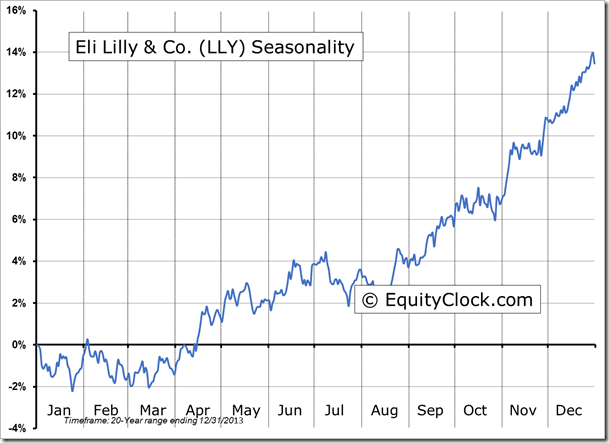
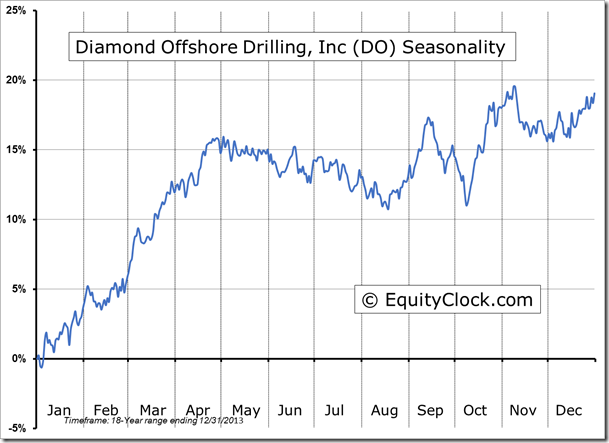
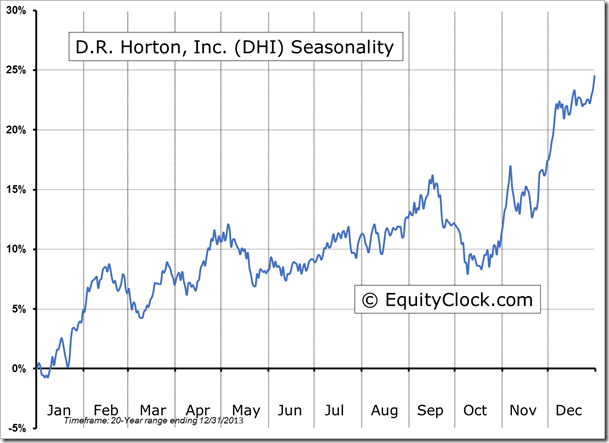
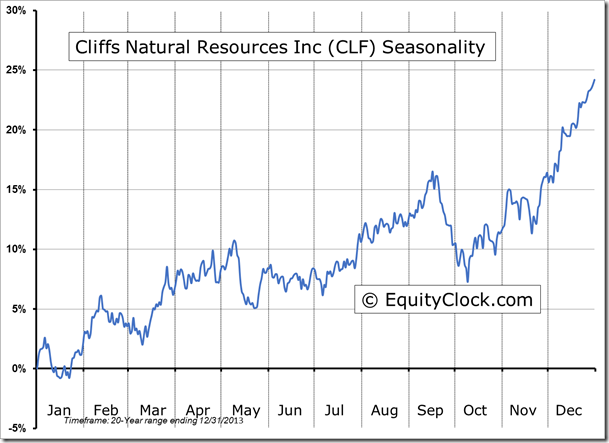
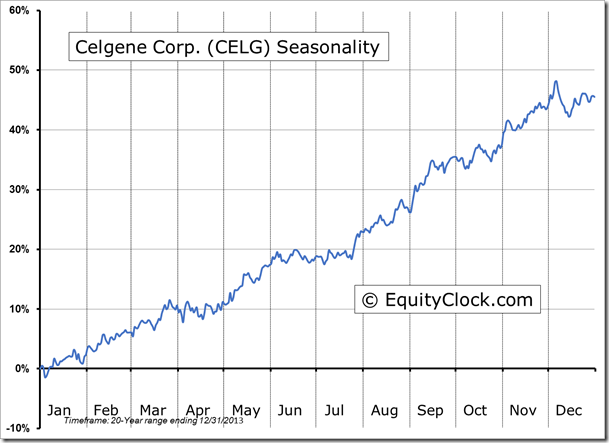
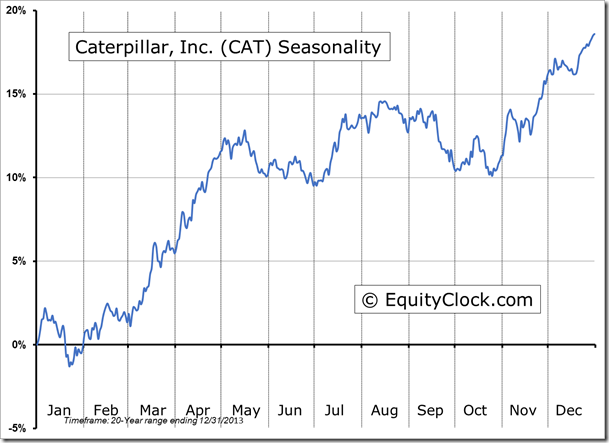
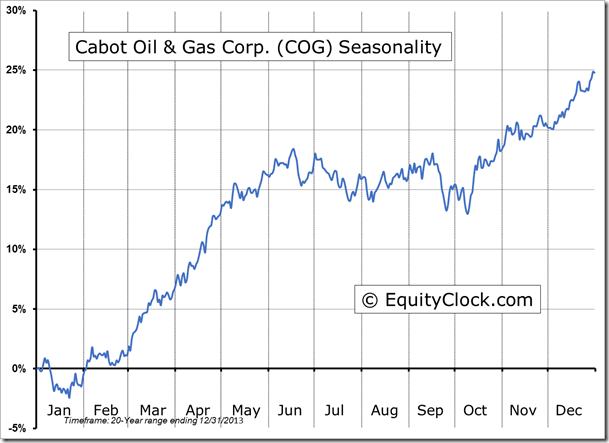
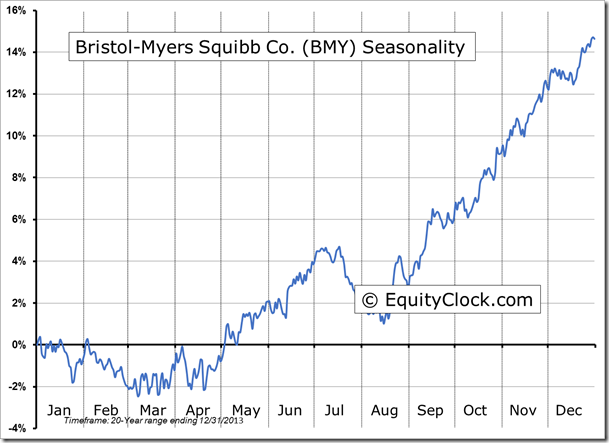
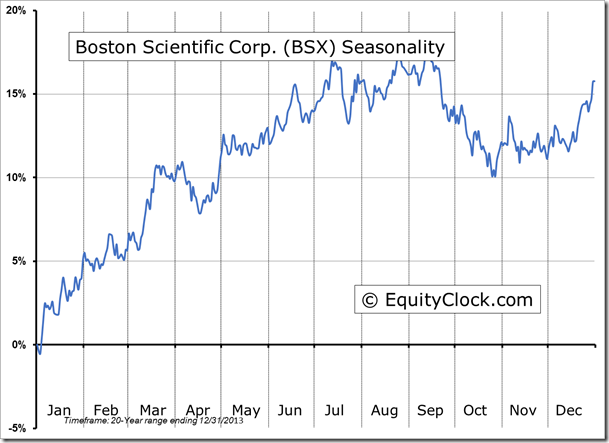
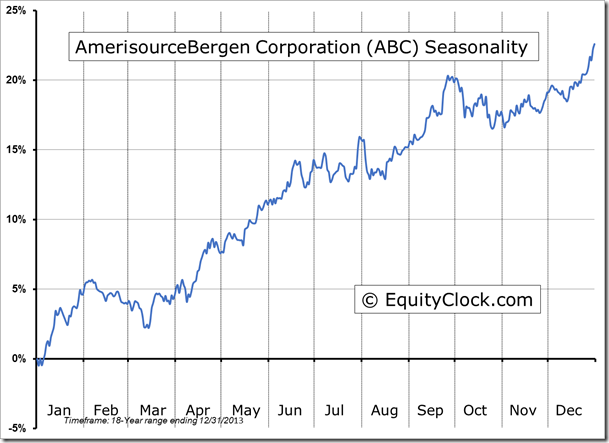
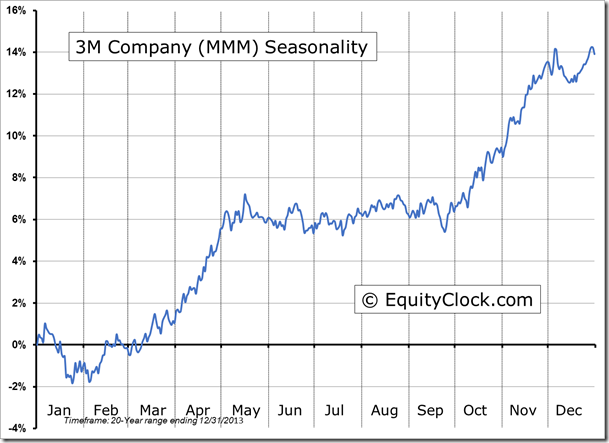
Seasonal charts of companies reporting earnings today:
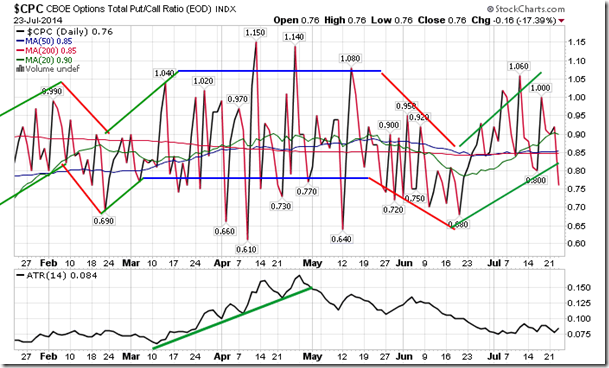
Sentiment on Wednesday, as gauged by the put-call ratio, ended bullish at 0.76. With the new closing high in the S&P 500, investors appear to be letting down their guard in protective puts, instead leaning towards upside calls. Increasing complacency, such as this, often leaves investors vulnerable to shocks.
S&P 500 Index
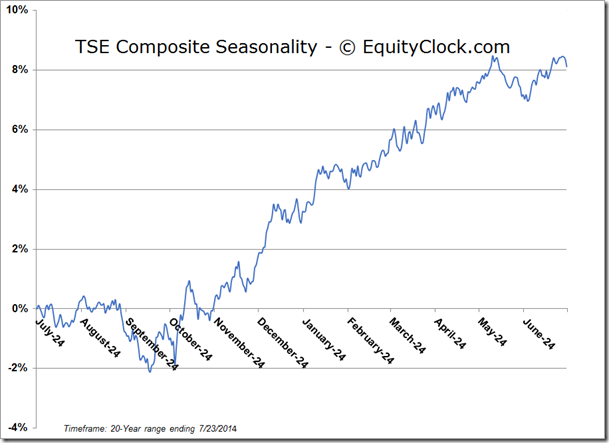
TSE Composite
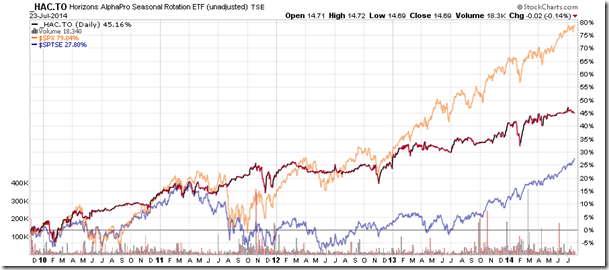
Horizons Seasonal Rotation ETF (TO:HAC)
- Closing Market Value: $14.69 (down 0.14%)
- Closing NAV/Unit: $14.68 (down 0.03%)
Performance*
| 2014 Year-to-Date | Since Inception (Nov 19, 2009) | |
| HAC.TO | 2.66% | 46.8% |
* performance calculated on Closing NAV/Unit as provided by custodian
