Upcoming US Events for Today:
- Retail Sales for December will be released at 8:30am. The market expects no change (0.0%) on a month-over-month basis versus an increase of 0.7% previous. Less Autos and Gas, sales are expected to increase by 0.3% versus an increase of 0.6% previous.
- Import/Export Prices for December will be released at 8:30am.
- Business Inventories for November will be released at 10:00am. The market expects a month-over-month increase of 0.3% versus an increase of 0.7% previous.
Upcoming International Events for Today:
- Japan Economy Watchers Survey for December will be released at 12:00am EST. The market expects 54.0 versus 53.5 previous.
- Great Britain CPI for December will be released at 4:30am EST. The market expects a year-over-year increase of 2.1%, consistent with the previous report.
- Euro-Zone Industrial Production for November will be released at 5:00am EST. The market expects a year-over-year increase of 1.8% versus an increase of 0.2% previous.

The Markets
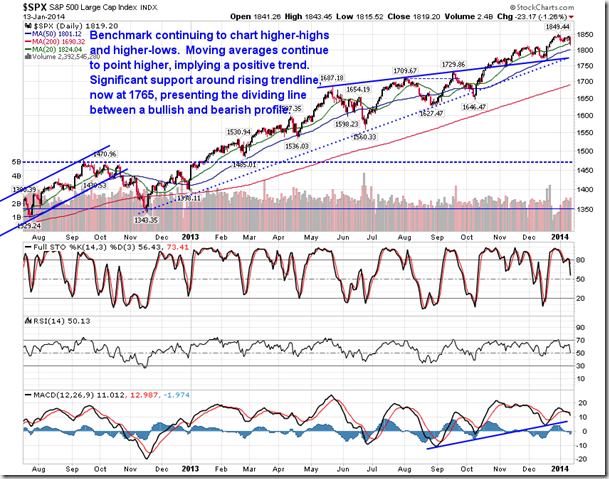
Stocks ended sharply lower on Monday as investors continued to digest Friday’s weak employment report. Stocks generally closed higher on Friday following the report, speculating that the Fed would be forced to restrain taper activity based on the weak employment result. However, Atlanta Fed President Dennis Lockhart indicated on Monday that he would support further tapering this year, which led investors to shed risk, selling stocks predominantly in cyclical sectors. A note from an equity strategist at Goldman Sachs added to the negative tone on the session by indicating that “S&P 500 valuation is lofty by almost any measure.” The firm still expects the large cap index to punch out a gain for the year in the single digit percentage range, however, the probability of a textbook correction of 10% or more sometime during the year is elevated. The risk-off session led investors to buy bonds and gold as the classic fear trade catches new life. As noted in yesterday’s report, bonds have broken out above an intermediate declining trendline as the “short bond” trade that was a winner last year shows signs of unwinding. The charts of the Intermediate-term and Long-term Treasury Bond ETFs are both suggesting a higher intermediate low, which could be conducive to further gains in the fixed income asset class. Gains in the bond market would buck the typical seasonal trend at this time of year that calls for losses through to April. The bond market has effectively traded inverse to its seasonal trends for the past year and a half as investors speculate upon Fed tapering.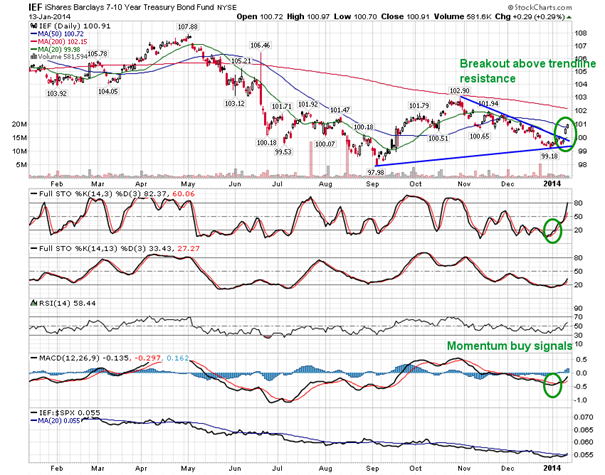
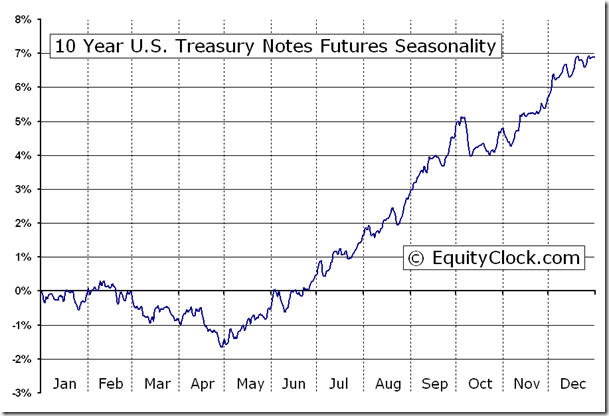
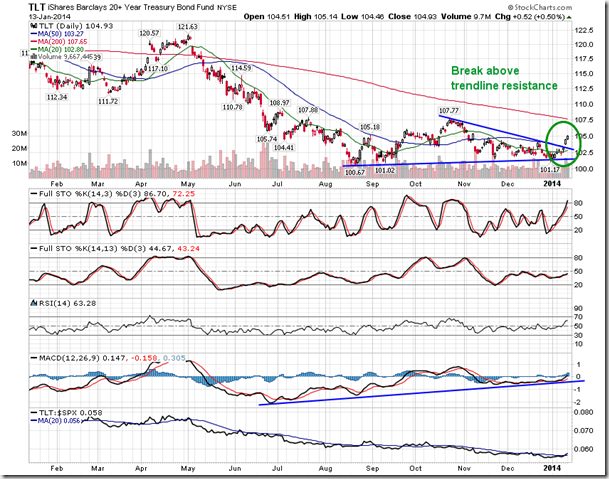
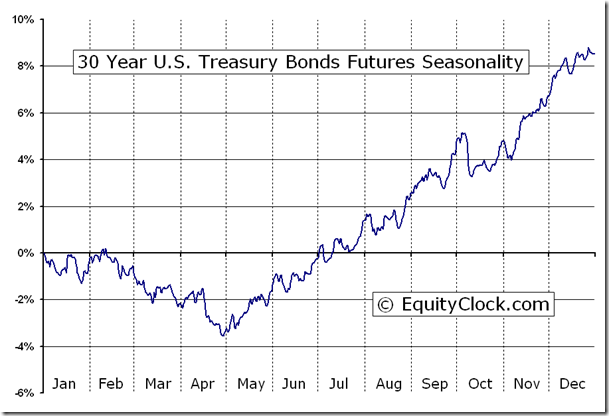
The losses in equity markets follows a low hit at significant support in the volatility index. The so-called “fear gauge” hit a low of 11.82 on Monday morning and bounced higher by around 10% at the close of the session. Significant support for the VIX is obvious around 12, a level that when hit usually coincides with short-term equity market peaks, a scenario which seems to be proving true yet again.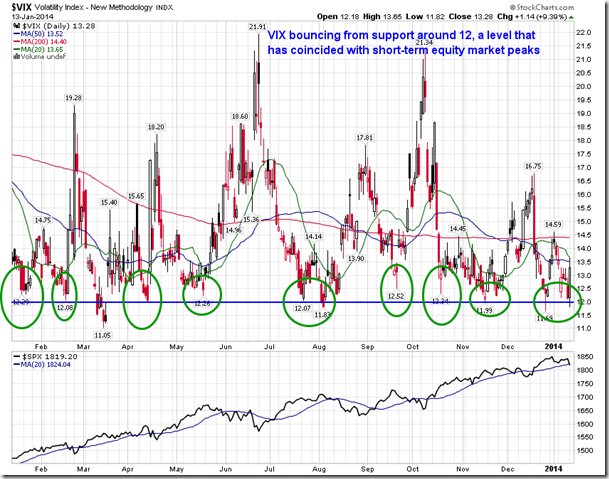
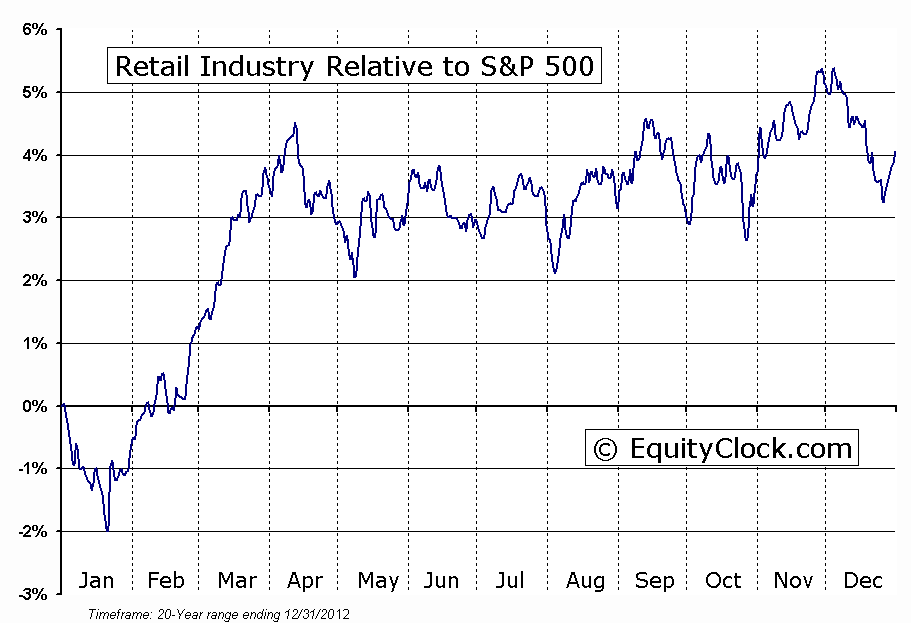
Perhaps the largest declines out of all of the equity industries were realized amongst the retailers. The S&P Retail Index ETF (XRT) fell almost 3% on the session as investors react to lacklustre holiday sales; the government report on retail sales for the month of December will be released today before the opening bell. The Retail ETF has now shown a significant break below the long-term positive trendline that carried the retail industry and the discretionary sector to all-time highs; the impact on equity benchmarks, as a result, has also been significant. The newly identified negative trend could prove to be detrimental to the upcoming period of seasonal strength for the industry, which runs from late January to early April. Minor support for the Retail ETF (XRT) can be found directly below at $83, the resistance peaks from the summer months.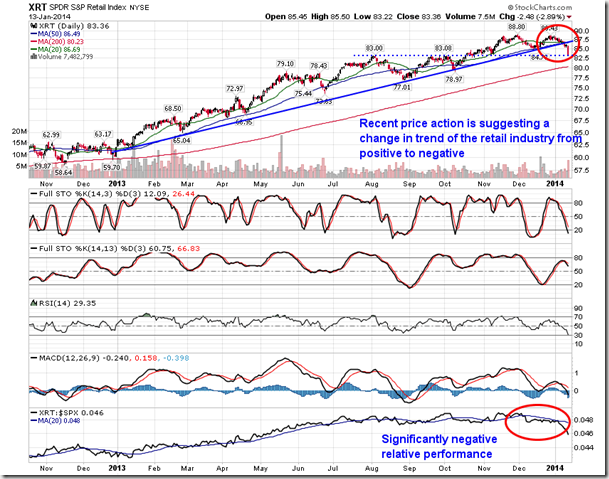
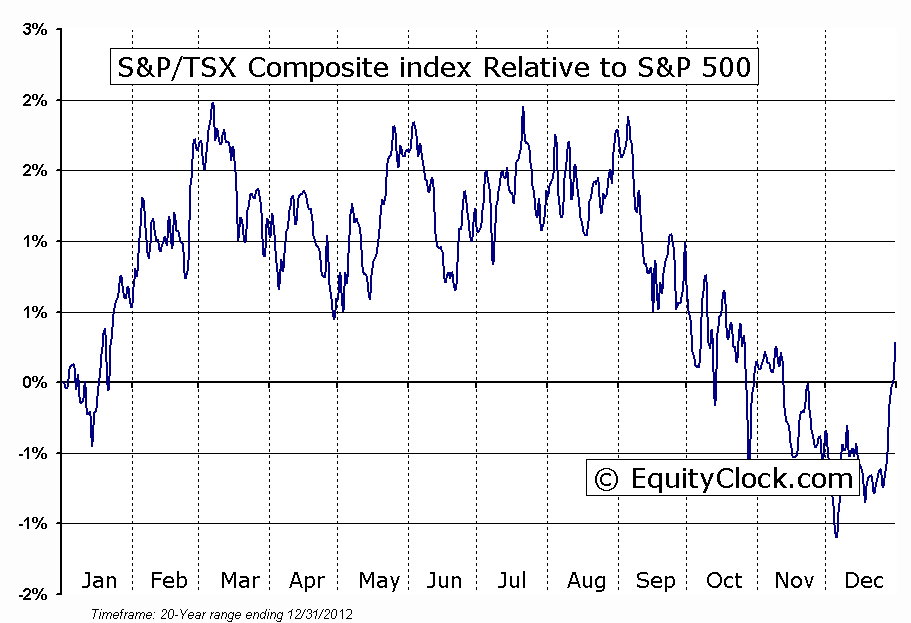
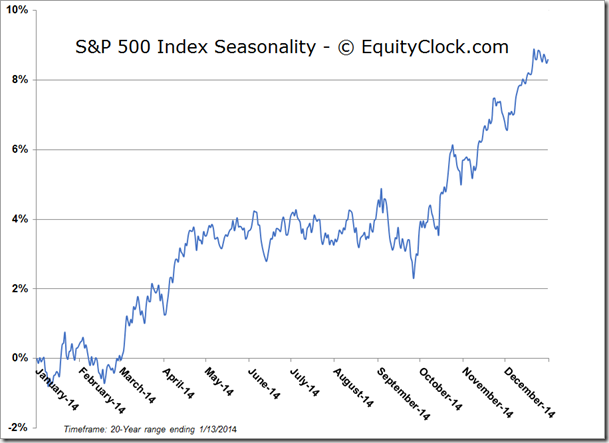
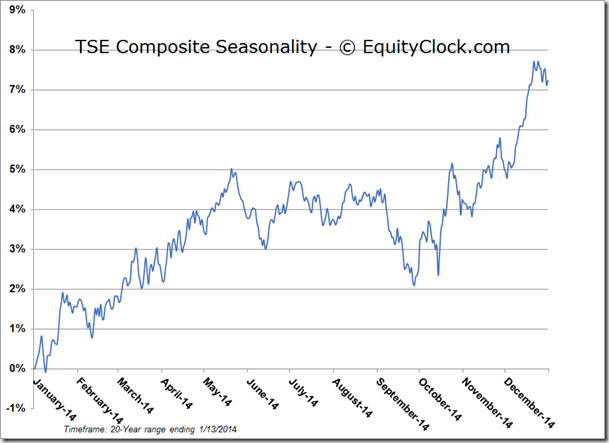
Despite the downfall of stocks in US benchmarks, Canadian equities are holding up relatively well as material stocks benefit from stabilizing metal prices. The TSX Composite has been outperforming the S&P 500 Index since mid-December, a trend that is typical on a seasonal basis; the Canadian benchmark seasonally outperforms US benchmarks between mid-December and mid-March as material, financial, and energy stocks outperform other sectors of the market. The Energy sector enters its period of seasonal strength within the next couple of weeks.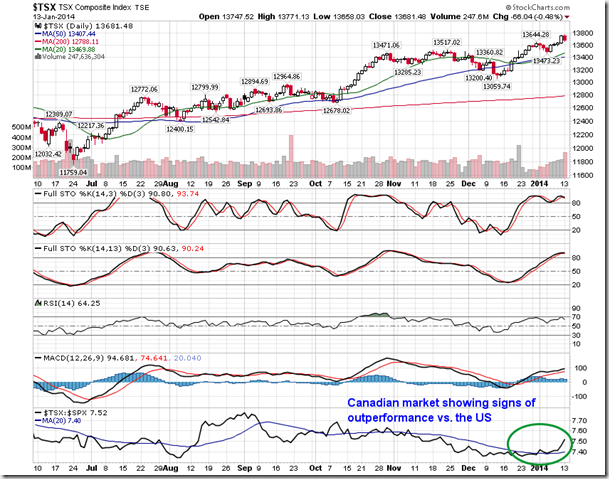
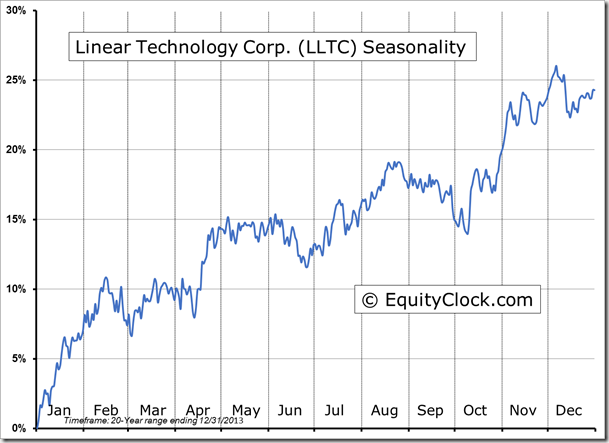
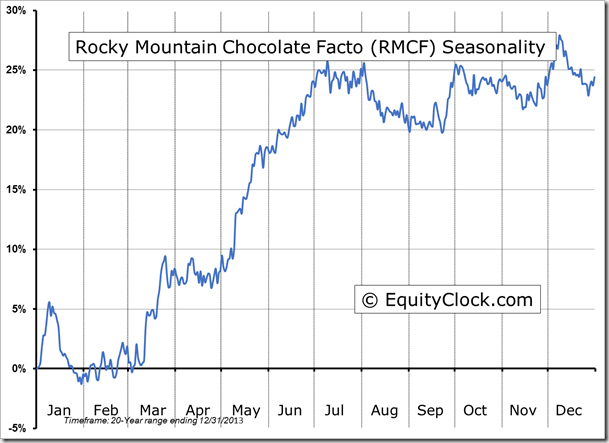
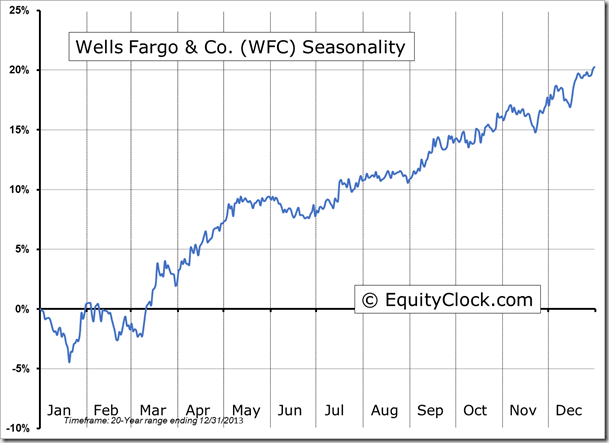
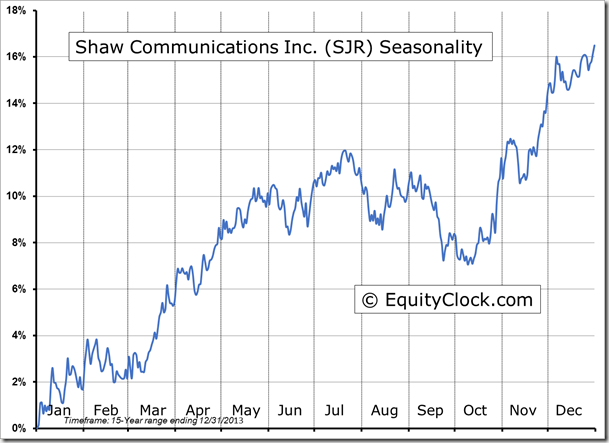
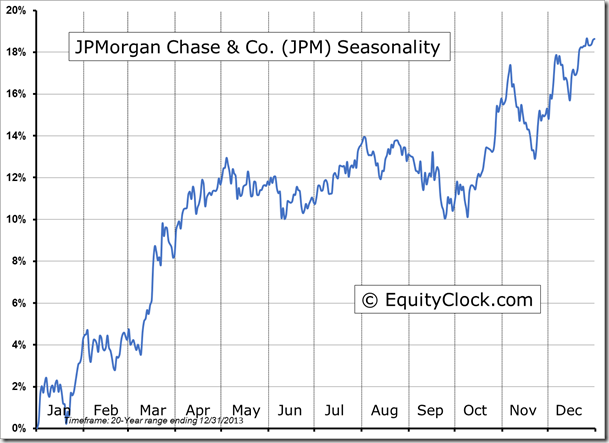
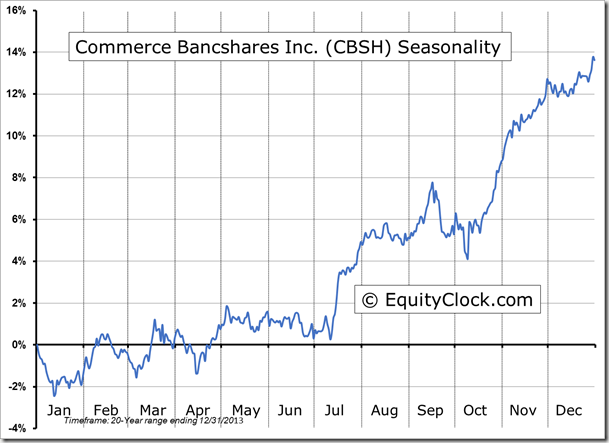
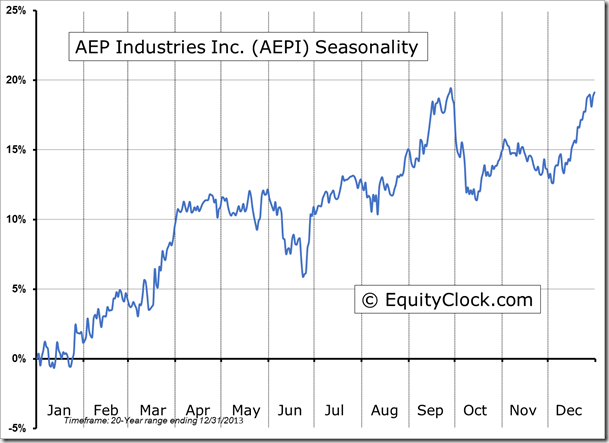
Seasonal charts of companies reporting earnings today: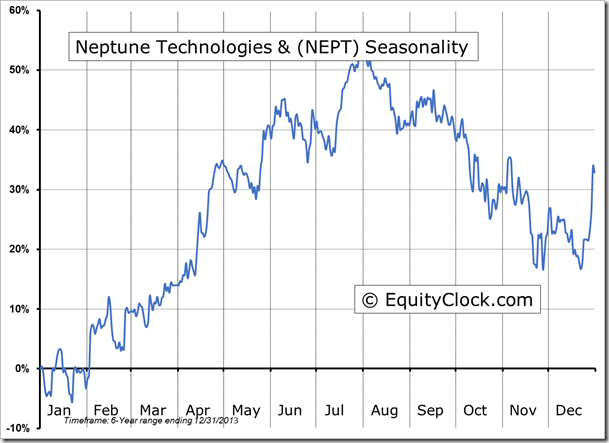
Sentiment on Monday, as gauged by the put-call ratio, ended bullish at 0.72. Despite the apparent downturn in equity prices, investors have yet to show signs of concern, refraining from aggressively purchasing put options in order to protect portfolio positions.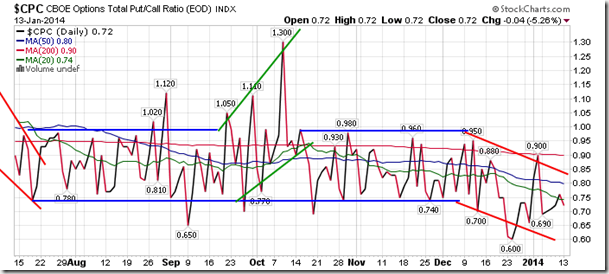
TSX Composite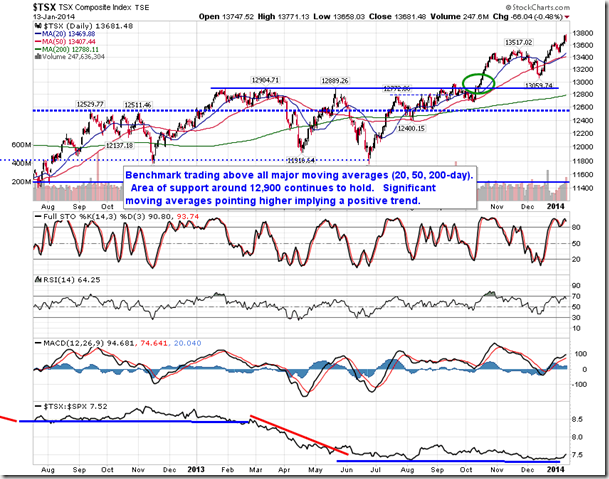
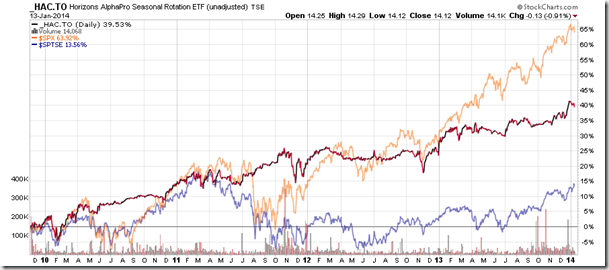
Horizons Seasonal Rotation ETF (TSX:HAC)
- Closing Market Value: $14.12 (down 0.91%)
- Closing NAV/Unit: $14.14 (down 1.00%)

