Upcoming US Events for Today:
- Wholesale Trade for July will be released at 10:00am. The market expects a month-over-month increase of 0.5% versus an increase of 0.3% previous.
- Weekly Crude Inventories will be released at 10:30am.
Upcoming International Events for Today:
- Consumer Price Index for August will be released at 9:30pm EST. The market expects a year-over-year increase of 2.1% versus an increase of 2.3% previous.
- Producer price Index for August will be released at 9:30pm EST. The market expects a year-over-year decline of 1.2% versus a decline of 0.9% previous.
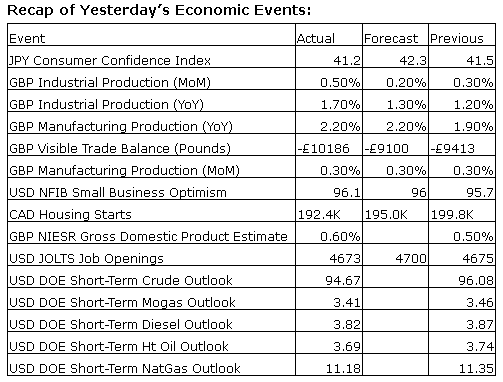
The Markets
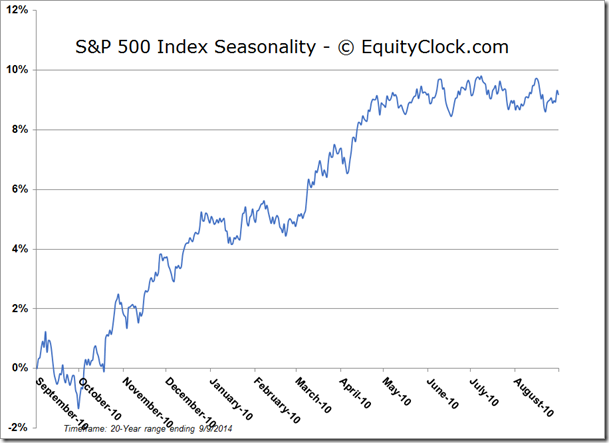
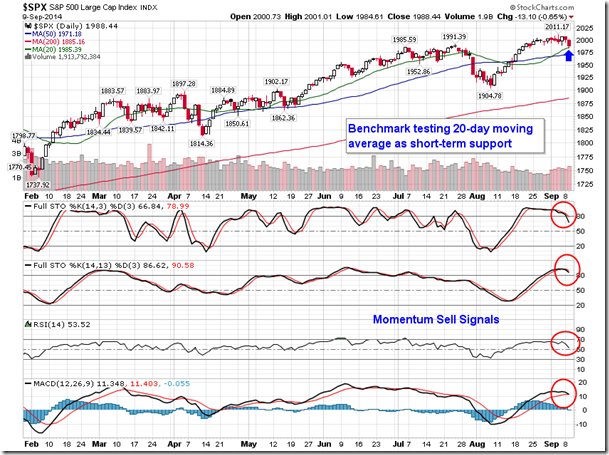
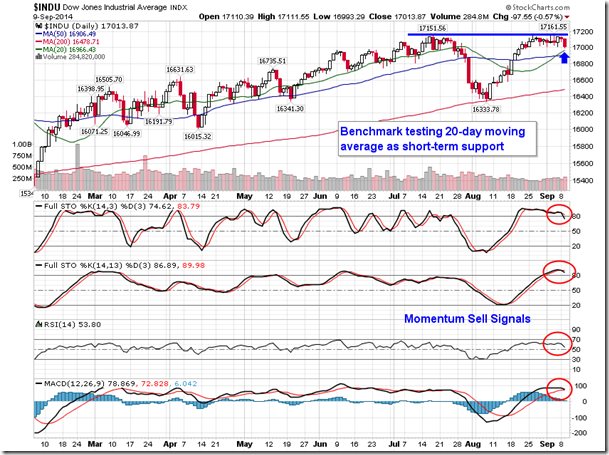
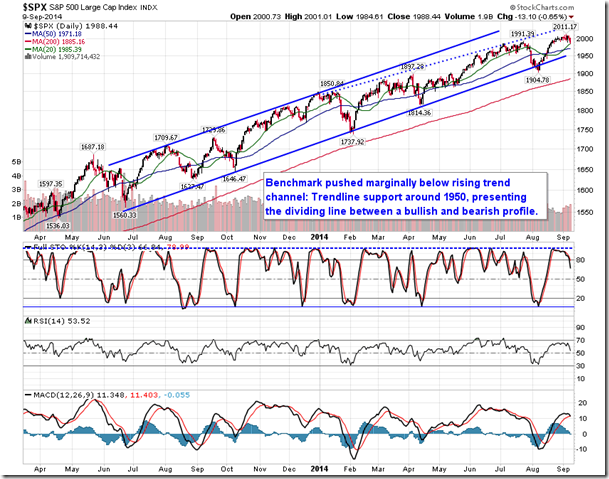
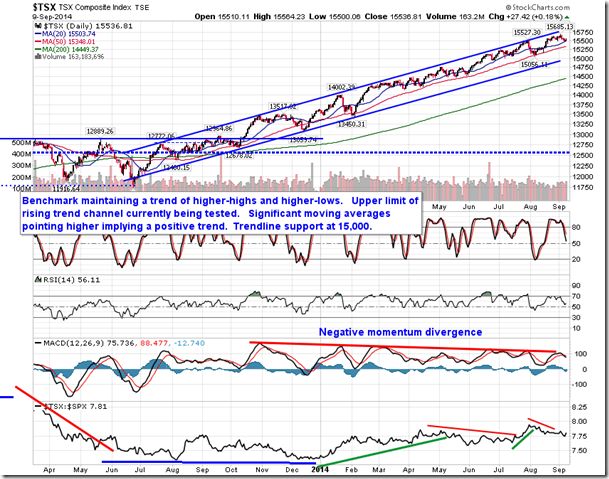
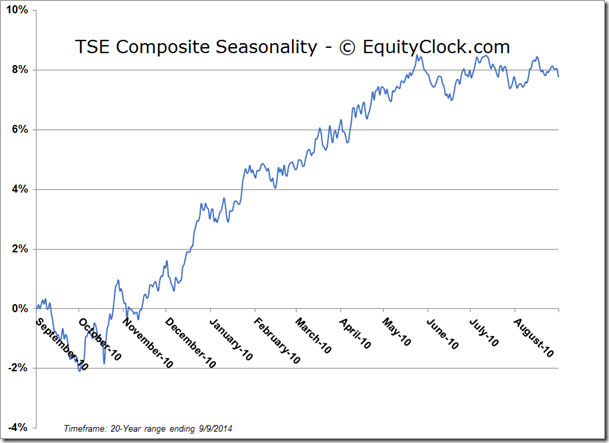
Stocks traded firmly lower on Tuesday, with the S&P 500 Index recording the largest one day loss since August 5th. The S&P 500 index and Dow Jones Industrial Average are presently testing their respective 20-day moving averages as a level of short-term support. Momentum sell signals are starting to trigger with respect to MACD, Stochastics, and RSI, suggesting further downside ahead. Of course, these sell signals are triggering directly ahead of the weakest and most volatile time of year for the equity market when stocks have shown a history of recording pronounced declines ahead of the start of the last quarter of the year. The approximately three week period of weakness runs from September 16th through to October 9th, on average, however, there is no reason to suspect that it hasn’t already begun. The period of weakness leads into what is commonly considered to be the strongest period for stocks from the end of October through to the beginning of May. Historically, the best areas of the market to buy upon weakness over the next few weeks include transportation, technology, and consumer stocks, all of which begin periods of seasonal strength early in October, benefiting from the run-up to the end of year holiday season.
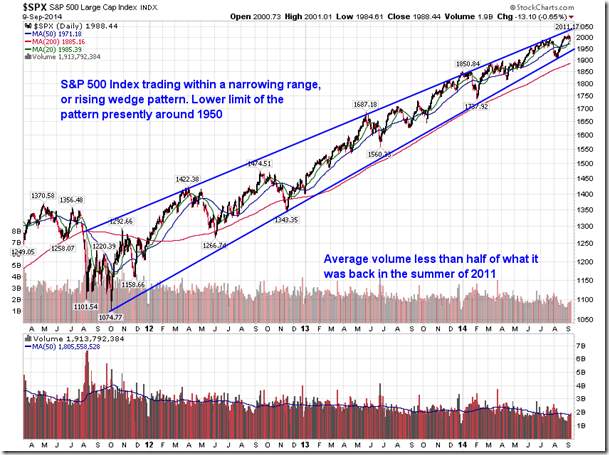
With the potential for declines ahead, it is worthwhile to highlight levels of support below the equity market. Looking at the S&P 500 Index, long-term trendline support can be found around 1950, or a mere 2% below present levels. This long-term trendline support also represents the lower limit of a rising wedge pattern, typically a bearish setup if confirmed by a breakdown below the lower limit of the pattern. The rising wedge pattern dates back to the last significant equity market correction in 2011 and has been accompanied by declining volumes ever since; average volume is currently less than half of what it was at this time in 2011. The suggestion is that the higher the equity market has climbed, the less interested investors are to participate, leading to upside exhaustion. The pattern is slowly reaching a peak and a breakup or breakdown will eventually be realized; the greater probability leans towards the latter of the two.
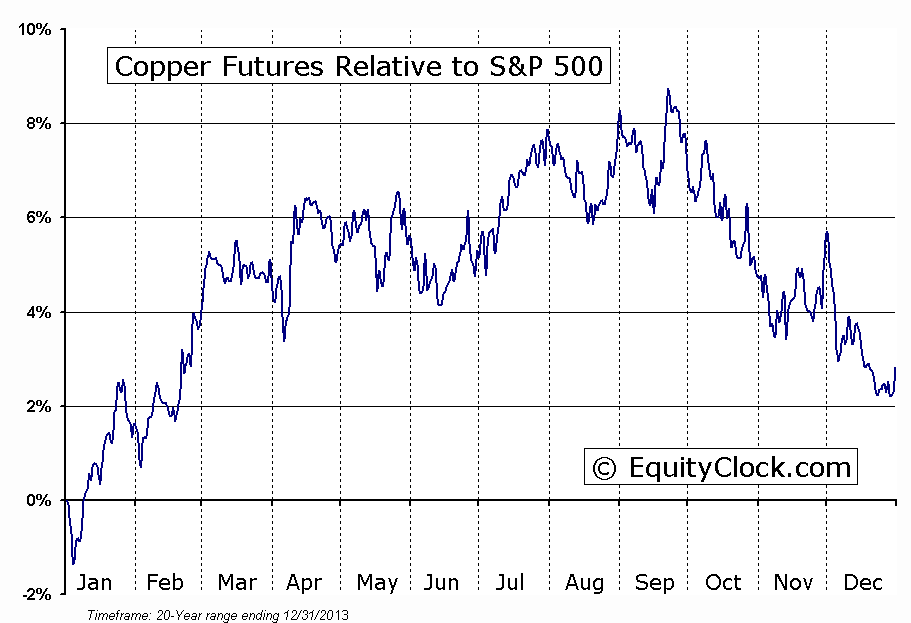
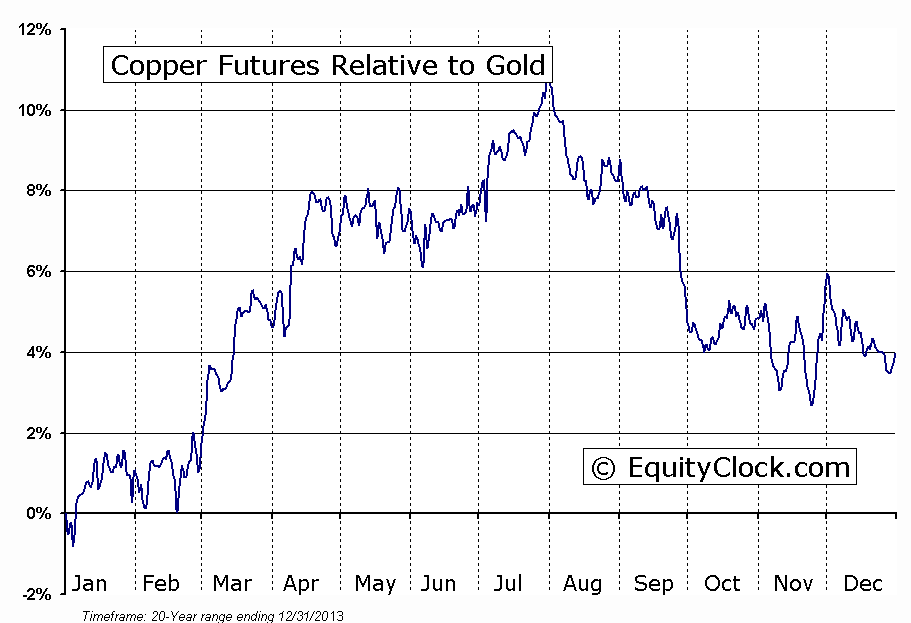
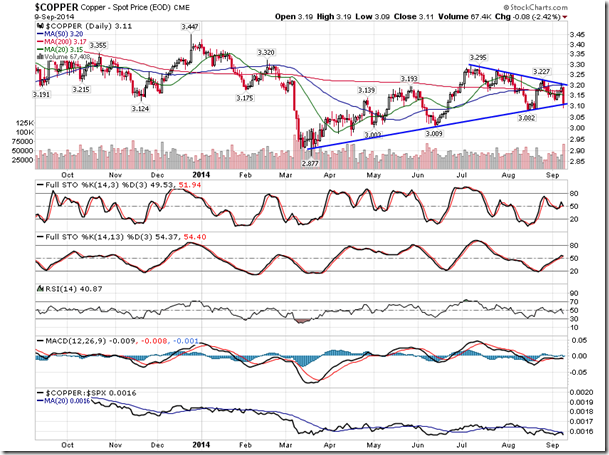
Flipping to the commodity market, notable activity was recorded for the price of Copper on Tuesday. The industrial metal plunged almost two and a half percent, trading lower from short-term resistance around $3.20 to close around intermediate support around $3.10. Trading activity is reaching the peak of a triangle consolidation pattern, suggesting a breakout, either up or down, is near, likely defining the intermediate path of the metal through the end of the year. Historically, the trading activity of copper has been perceived as a leading indicator for the economy, rising or falling based upon demand for the raw input. Therefore, the next move may be significant, providing early indication of economic reports relating to third quarter GDP all the way down to individual manufacturing reports. Whether or not the equity market will react in conjunction with the economic data is a question that may be better answered by the Fed. Seasonal tendencies for the metal turn negative during the last four months of the year.
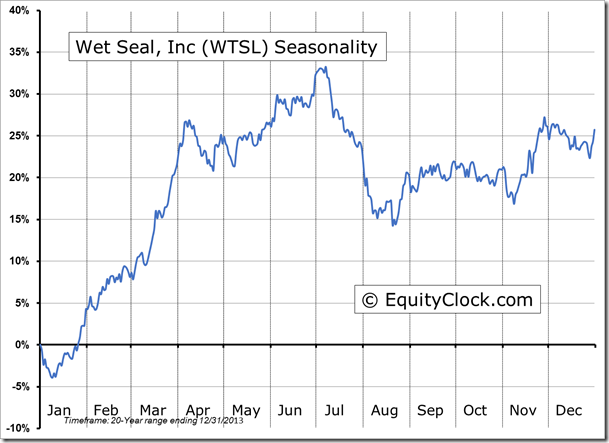
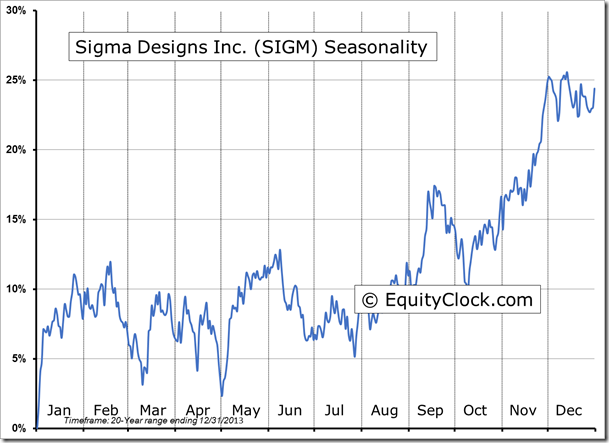
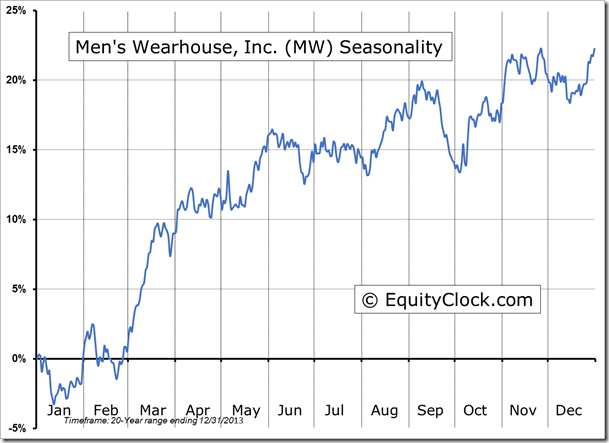
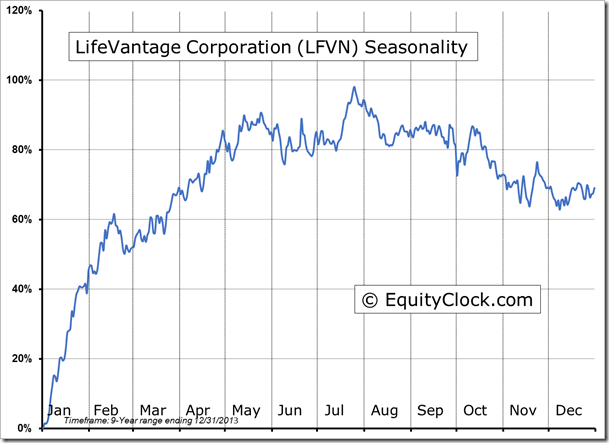
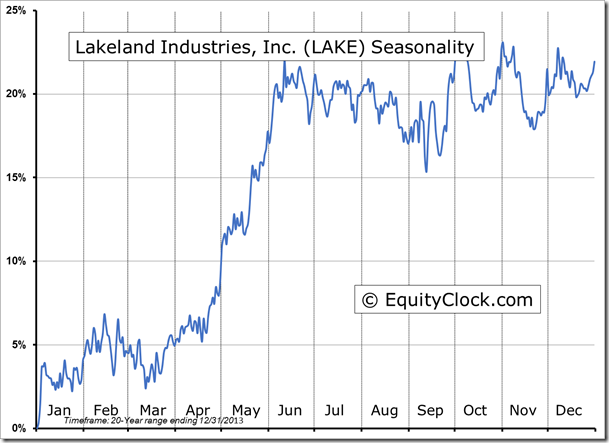
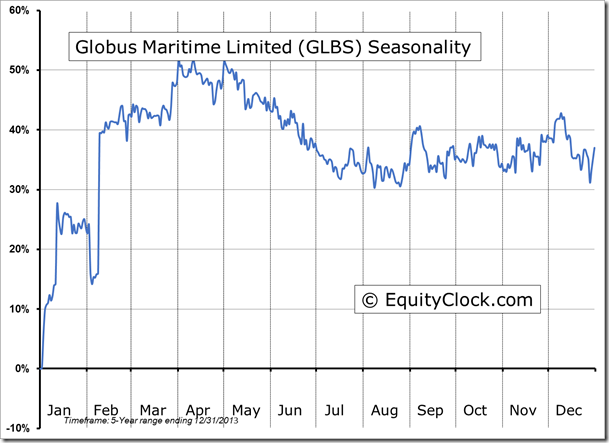
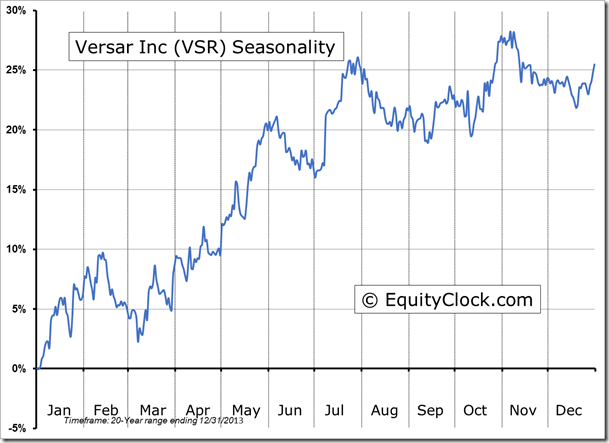
Seasonal charts of companies reporting earnings today:
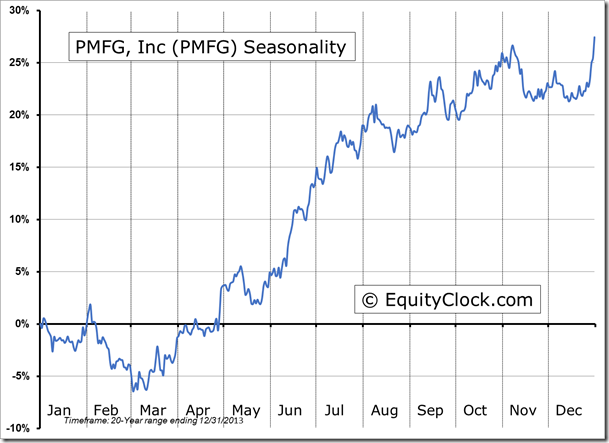
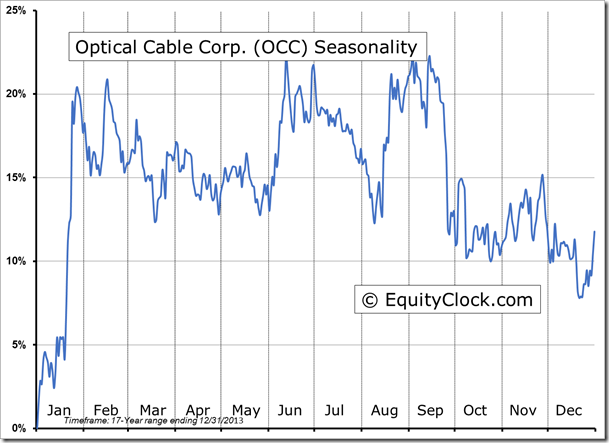
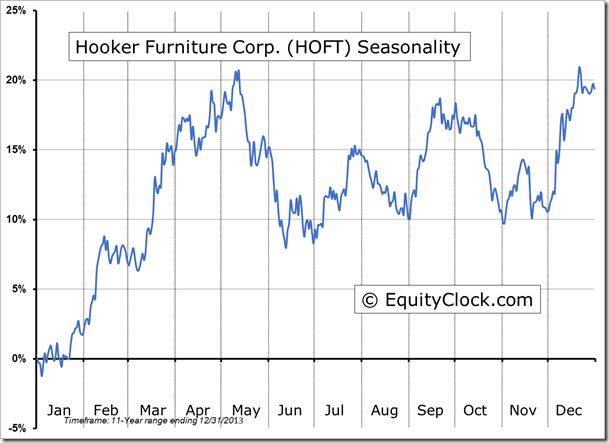
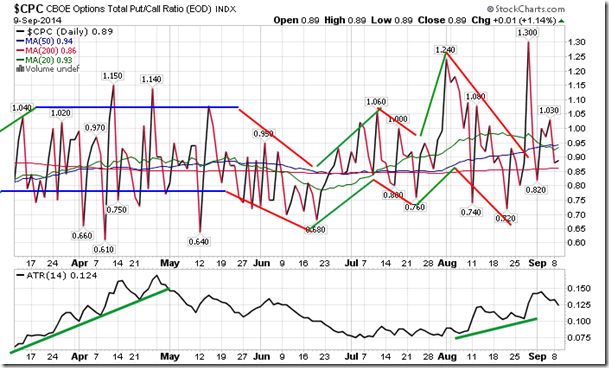
Sentiment on Tuesday, as gauged by the put-call ratio, ended bullish at 0.89.
S&P 500 Index
TSE Composite
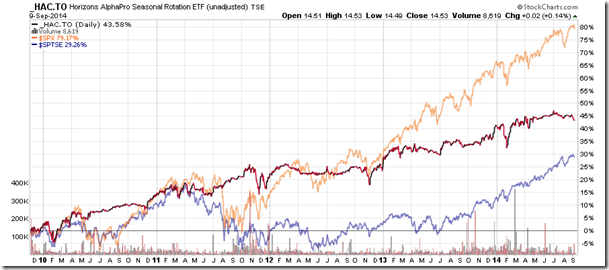
Horizons Seasonal Rotation ETF (TSX:HAC)
- Closing Market Value: $14.53 (up 0.14%)
- Closing NAV/Unit: $14.56 (up 0.34%)
Performance*
| 2014 Year-to-Date | Since Inception (Nov 19, 2009) | |
| HAC.TO | 1.82% | 45.6% |
* performance calculated on Closing NAV/Unit as provided by custodian
