
**NEW** As part of the ongoing process to offer new and up-to-date information regarding seasonal and technical investing, we are adding a section to the daily reports that details the stocks that are entering their period of seasonal strength, based on average historical start dates. Stocks highlighted are for information purposes only and should not be considered as advice to purchase or to sell mentioned securities. As always, the use of technical and fundamental analysis is encouraged in order to fine tune entry and exit points to average seasonal trends.
Stocks Entering Period of Seasonal Strength Today:
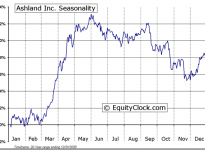
Ashland Inc. (NYSE:ASH) Seasonal Chart
The Markets
Stocks traded higher on Monday, yet again pushing the S&P 500 Index and Dow Jones Industrial Average to new closing highs. Despite significantly overbought conditions, the S&P 500 Index charted the 27th straight session above its 5-day moving average, setting a record for the longest run above this short-term average in the past 60 years.The 5-day average, which continues to support the short-term trend of the large-cap benchmark, currently sits at 2057.24. According to the Relative Strength Index, the S&P 500 Index is now the most overbought since September 14 of 2012, leaving the benchmark vulnerable to a retracement given the upside exhaustion. Short-term seasonal tendencies for the equity market remain positive through the remainder of this holiday week before softening into early December when tax loss selling pressures are typical.

A couple of key benchmarks in the US are testing long-term resistance. The Russell 2000 Small Cap index is bumping up against resistance just above 1180, while the NYSE Composite is testing resistance around 11,100. These benchmarks remain some of the few holdouts amongst the slew of new 52-week highs charted over the last couple of weeks. Seasonally, both benchmarks tend to outperform the S&P 500 index between now and the end of the year, implying that if a breakout is recorded, investors may rotate towards these indices that have greater exposure to small cap stocks. A word of caution, however. Small caps have meandered around the flatline for much of the year, making them vulnerable to tax loss selling pressures at the start of December; as of November 20th, the Russell 2000 was up a mere 0.61% on the year. Since 1987, when the Russell 2000 Index has recorded a year-to-date return of 5% or less by November 20th, the small-cap benchmark has recorded a loss each year during the tax loss selling period that runs between December 5th and December 15th; declines over this short-term negative period average 1.72%. Tax loss selling pressures typically lead to ideal buying opportunities in small-cap stocks for the dominant period of strength that runs through the last two weeks of the year.


Meanwhile, north of the border, Canadian banks begin to report earnings next week, reaction to which will be widely watched as they encompass a significant portion of Canadian portfolios. Two Canadian banking/financial ETFs are approaching resistance at the September high. The BMO S&P/TSX Equal Weight Bank ETF (TO:ZEB) is bumping up against the high of $24.72, while the iShares S&P/TSX Capped Financials Index Fund (TO:XFN) is testing the high of $32.64; momentum indicators for both are showing signs of rolling over as price action stalls ahead of the earnings result. Reaction to the numbers will either confirm the level of resistance, sending the Canadian financial sector back lower, or fuel a breakout, resuming the long-term trend that has remained intact since 2012. Seasonal tendencies for the Canadian Financial sector remain positive through the end of the year, although volatility surrounding the numbers is typical.


Sentiment on Monday, as gauged by the put-call ratio, ended bullish at 0.79.

Seasonal charts of companies reporting earnings today:


S&P 500 Index


TSE Composite


Horizons Seasonal Rotation ETF (TO:HAC)
- Closing Market Value: $15.07 (up 0.40%)
- Closing NAV/Unit: $15.07 (up 0.44%)
Performance*
| 2014 Year-to-Date | Since Inception (Nov 19, 2009) | |
| HAC.TO | 5.38% | 50.7% |
* performance calculated on Closing NAV/Unit as provided by custodian
